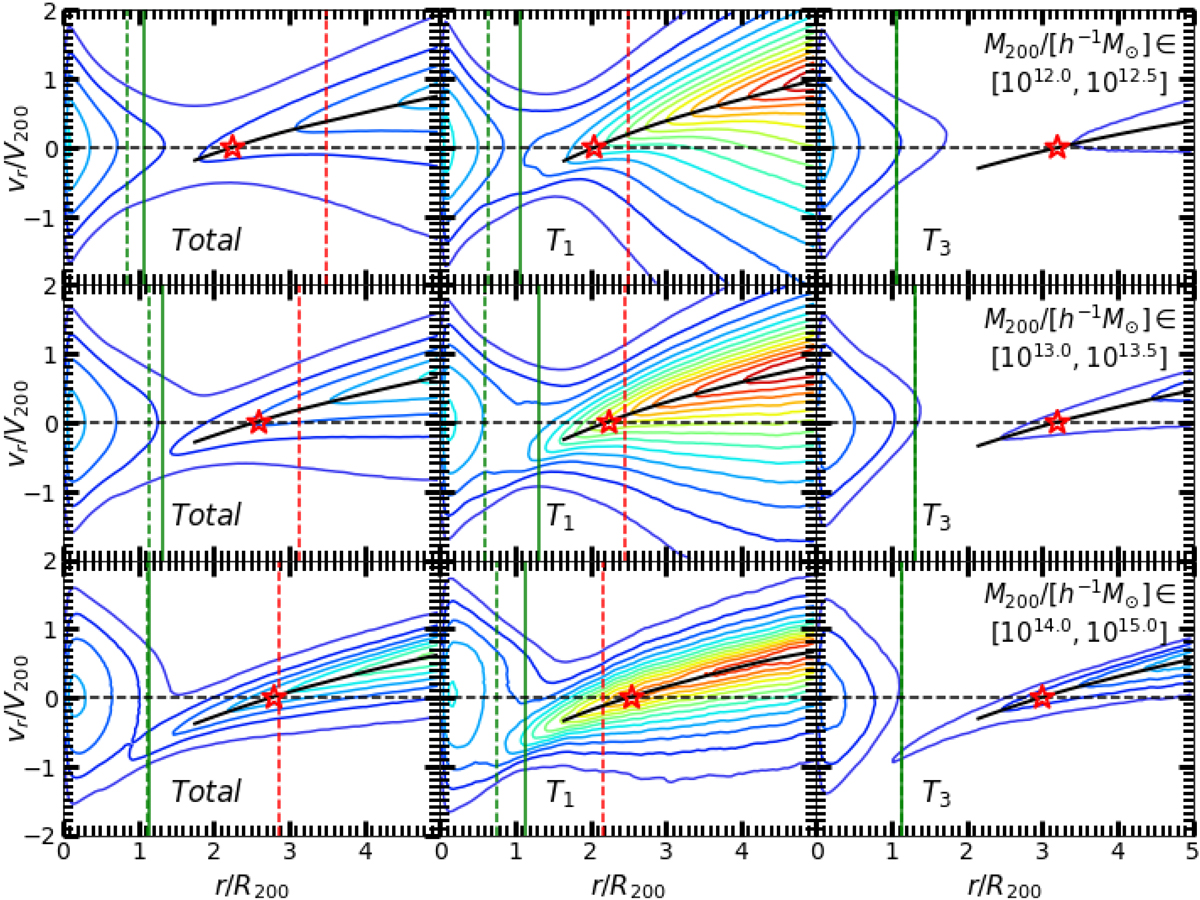
Fig. 11.
Download original image
Phase space diagrams of dark matter particles in three halo mass bins. The left, middle, and right columns show the results averaged over all direction (labeled as “total”), along T1 and T3, respectively. The contour lines are color coded according to the phase space density (see Eq. (4)); red(blue) means high(low) phase space density. The green and red vertical lines indicate the caustic and peak radii, respectively. The dashed vertical lines indicate the caustic radii measured in the total or T1 profiles, while the solid vertical lines indicate the radii measured in the T3 profiles and are also shown in total and T1 panels. The black solid lines show the contour maxima of the accretion components. The red pentagram indicates the turnaround radius.
Current usage metrics show cumulative count of Article Views (full-text article views including HTML views, PDF and ePub downloads, according to the available data) and Abstracts Views on Vision4Press platform.
Data correspond to usage on the plateform after 2015. The current usage metrics is available 48-96 hours after online publication and is updated daily on week days.
Initial download of the metrics may take a while.