Fig. 1.
Download original image
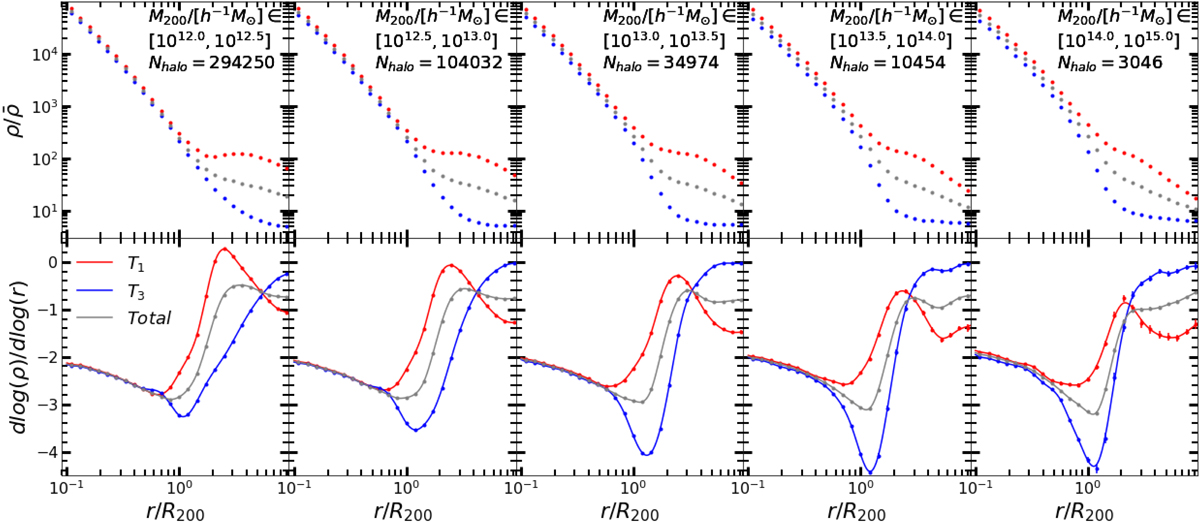
Mean dark matter density (upper panels) and density gradient (lower panels) profiles for halos in five mass bins, shown by the data points. The solid lines represent the best-fitting profiles using the GPR method. The gray symbols and lines show the results averaged over all directions, red for results along T1 direction, and blue for T3 direction. Error bars are estimated using 1000 bootstrap samples. The halo mass ranges are shown in the upper panels. The number of halos in each mass bin is shown in the corresponding upper panel. Please see Sect. 2.4 for details.
Current usage metrics show cumulative count of Article Views (full-text article views including HTML views, PDF and ePub downloads, according to the available data) and Abstracts Views on Vision4Press platform.
Data correspond to usage on the plateform after 2015. The current usage metrics is available 48-96 hours after online publication and is updated daily on week days.
Initial download of the metrics may take a while.