Open Access
Fig. 7.
Download original image
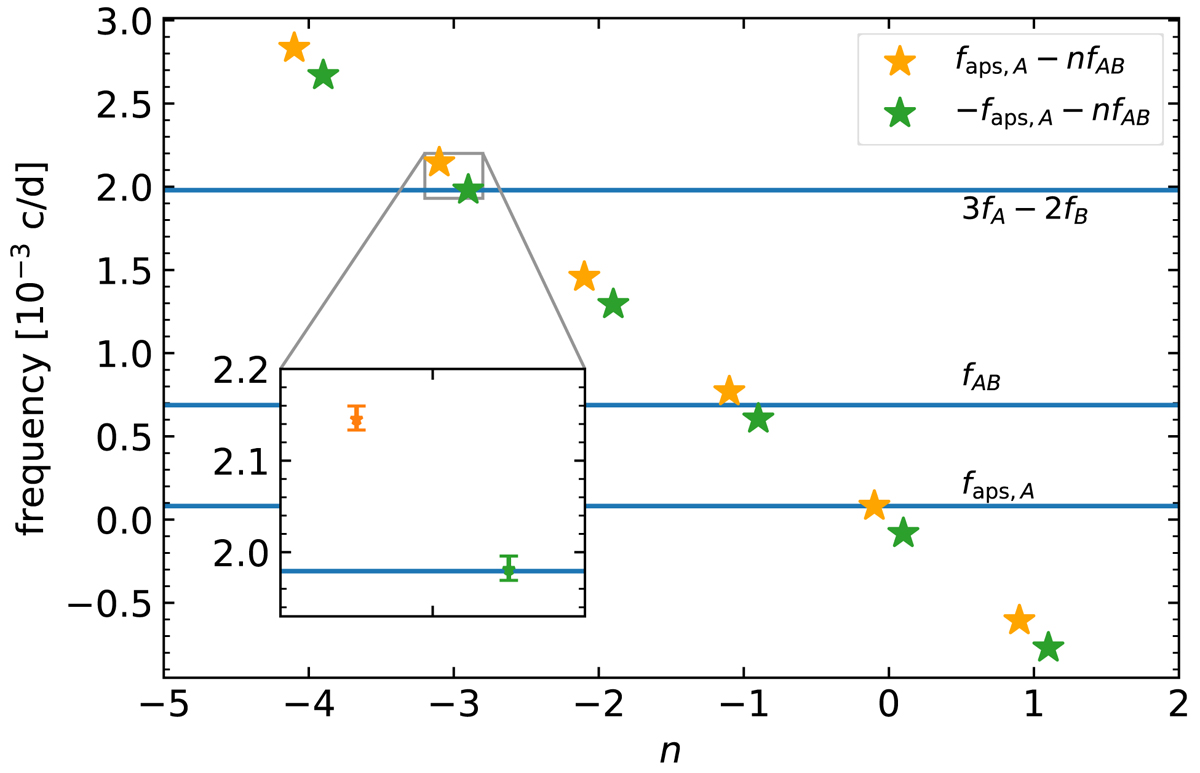
Period resonance in CzeV343. Blue horizontal lines show individual terms from Eq. (13) as determined by our photometric model. Orange and green stars show combinations of faps, A and fAB for different values of n. The inset plot shows zoom-in for n = −3, where we also show 95.4% confidence intervals from our model.
Current usage metrics show cumulative count of Article Views (full-text article views including HTML views, PDF and ePub downloads, according to the available data) and Abstracts Views on Vision4Press platform.
Data correspond to usage on the plateform after 2015. The current usage metrics is available 48-96 hours after online publication and is updated daily on week days.
Initial download of the metrics may take a while.