Fig. 4.
Download original image
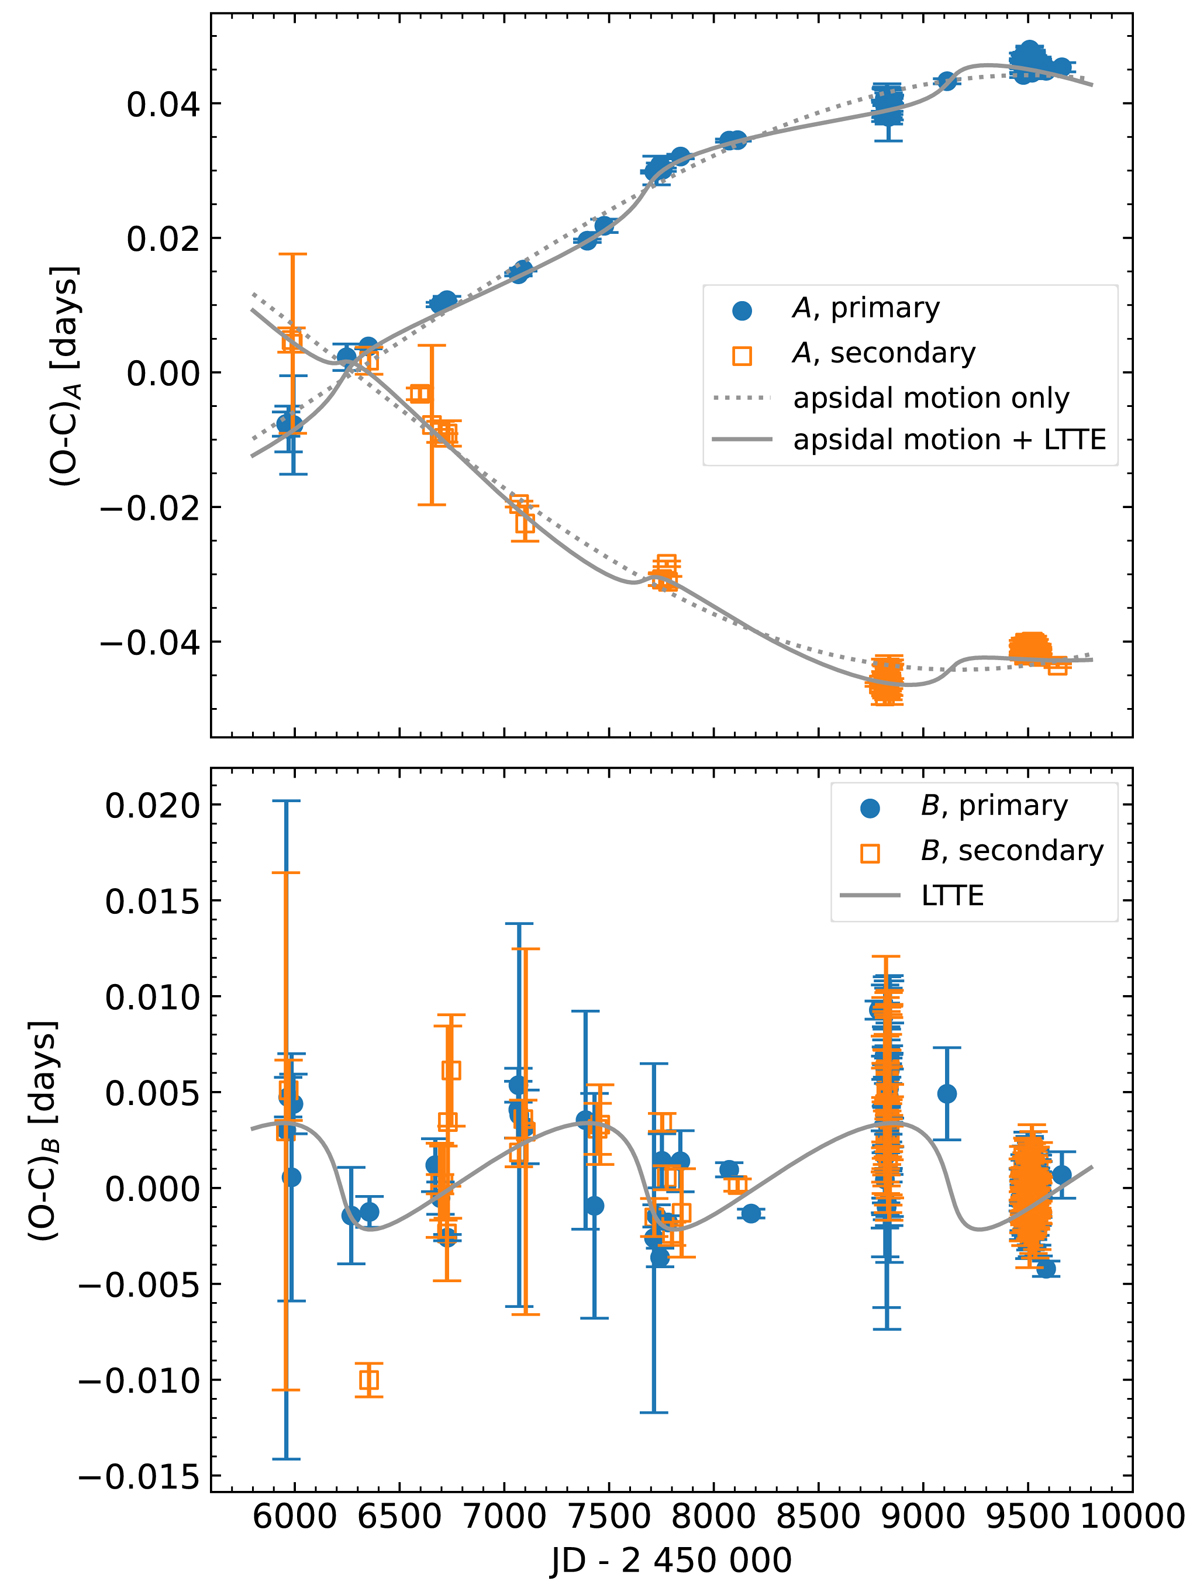
O − C diagram of binary A (top panel) and binary B (bottom panel) calculated by determining minima timings in all of our photometric data. Primary eclipses are shown in blue while secondary eclipses are shown in orange. Gray lines show O − C variations predicted by our best-fit global photometric model from Sect. 3.2. LTTE variations are calculated with Eqs. (5) and (6) and apsidal motion effect is evaluated using expressions from Gimenez & Garcia-Pelayo (1983).
Current usage metrics show cumulative count of Article Views (full-text article views including HTML views, PDF and ePub downloads, according to the available data) and Abstracts Views on Vision4Press platform.
Data correspond to usage on the plateform after 2015. The current usage metrics is available 48-96 hours after online publication and is updated daily on week days.
Initial download of the metrics may take a while.