Fig. 6
Download original image
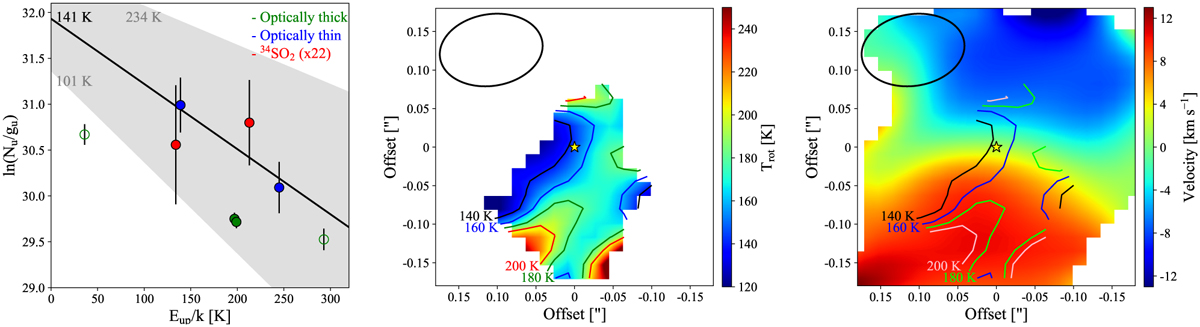
Temperature structure of IRS 44. Left: rotational diagram at the source position, where only the optically thin SO2 transitions (blue dots) and the 34SO2 lines (red dots) are used for the fit. The abundance ratio 32S/34S = 22 is from Wilson (1999). Optically thick SO2 transitions (green dots) and those lines where the optical depth is not conclusive (open dots) show a significant offset with respect to the other lines, and they were not included in the calculation of the rotational temperature and SO2 column densities. Center, rotational temperature map created from optically thin SO2 and 34SO2 transitions. Contours show specific values of 140, 160, 180, and 200 K. Right: moment 1 map (right panel of Fig. 2) with the same specific values of the rotational temperature as those of the central panel, showing that the highest temperatures coincide with the redshifted protrusion. The synthesized beam is shown by the black ellipse in the upper left corner and the yellow star indicates the position of the source.
Current usage metrics show cumulative count of Article Views (full-text article views including HTML views, PDF and ePub downloads, according to the available data) and Abstracts Views on Vision4Press platform.
Data correspond to usage on the plateform after 2015. The current usage metrics is available 48-96 hours after online publication and is updated daily on week days.
Initial download of the metrics may take a while.