Fig. 4
Download original image
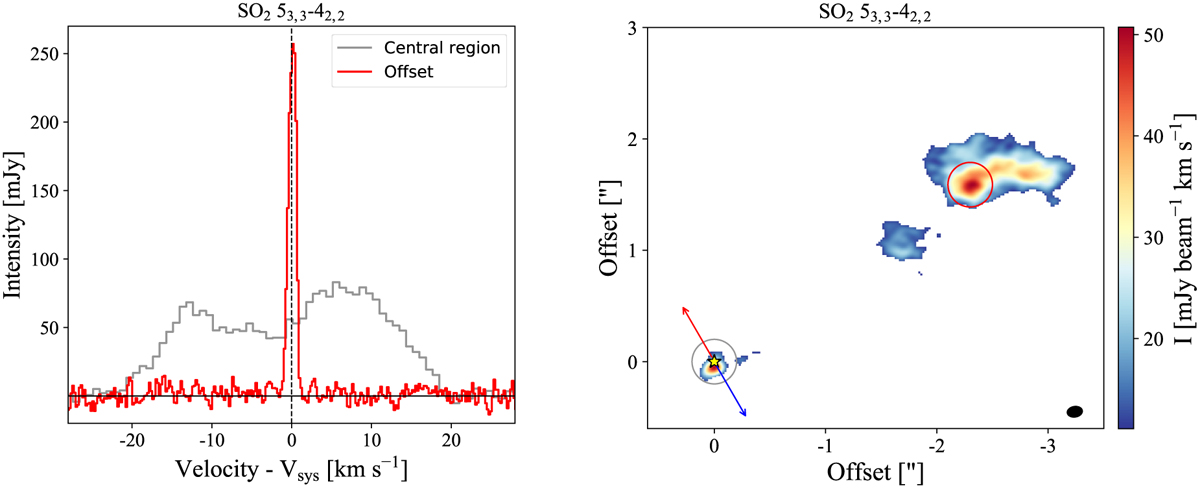
Emission of the SO2 53,3–42,2 line. Left: spectra integrated over a circular region with r = 0″.2, centered on the continuum peak position (gray) and centered on the offset region (red). The spectrum taken at the continuum peak position has been rebinned by a factor of 4. Right: moment 0 map above 3σ integrated over 60 km s−1. The gray and red circles represent the regions from which the spectra in the left panel were taken. The blue and red arrows show the direction of the outflow, the yellow star indicates the continuum peak position, and the synthesized beam is represented by the black filled ellipse in the bottom right corner. The adopted systemic velocity is 3.7 km s−1.
Current usage metrics show cumulative count of Article Views (full-text article views including HTML views, PDF and ePub downloads, according to the available data) and Abstracts Views on Vision4Press platform.
Data correspond to usage on the plateform after 2015. The current usage metrics is available 48-96 hours after online publication and is updated daily on week days.
Initial download of the metrics may take a while.