Fig. 3
Download original image
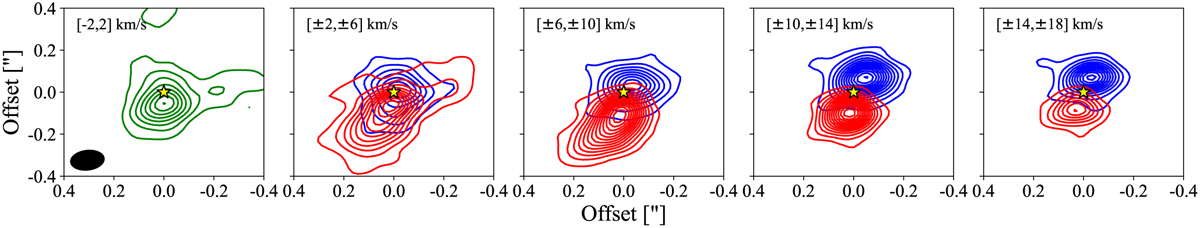
Contour maps of SO2 184,14–183,15 for different velocity ranges, shifted to 0 velocity. The contours start at 5σ and follow steps of 5σ. The panel that includes the systemic velocity (3.7 km s−1) is shown by the green contours in the first panel, while blue- and redshifted emission is represented by the blue and red contours, respectively. The yellow star shows the position of the source and the synthesized beam is indicated by the black filled ellipse in the bottom left corner of the first panel.
Current usage metrics show cumulative count of Article Views (full-text article views including HTML views, PDF and ePub downloads, according to the available data) and Abstracts Views on Vision4Press platform.
Data correspond to usage on the plateform after 2015. The current usage metrics is available 48-96 hours after online publication and is updated daily on week days.
Initial download of the metrics may take a while.