Open Access
Fig. B.3
Download original image
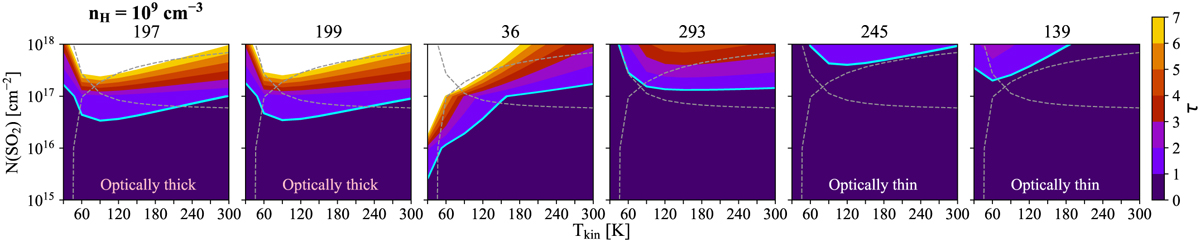
Optical depth for the six SO2 transitions obtained with RADEX with nH = 109 cm−3. The cyan contour represents τ =1 and the dashed gray contours indicate the range of possible values for ![]() and Tkin shown in Fig. B.2.
and Tkin shown in Fig. B.2.
Current usage metrics show cumulative count of Article Views (full-text article views including HTML views, PDF and ePub downloads, according to the available data) and Abstracts Views on Vision4Press platform.
Data correspond to usage on the plateform after 2015. The current usage metrics is available 48-96 hours after online publication and is updated daily on week days.
Initial download of the metrics may take a while.