Fig. B.1
Download original image
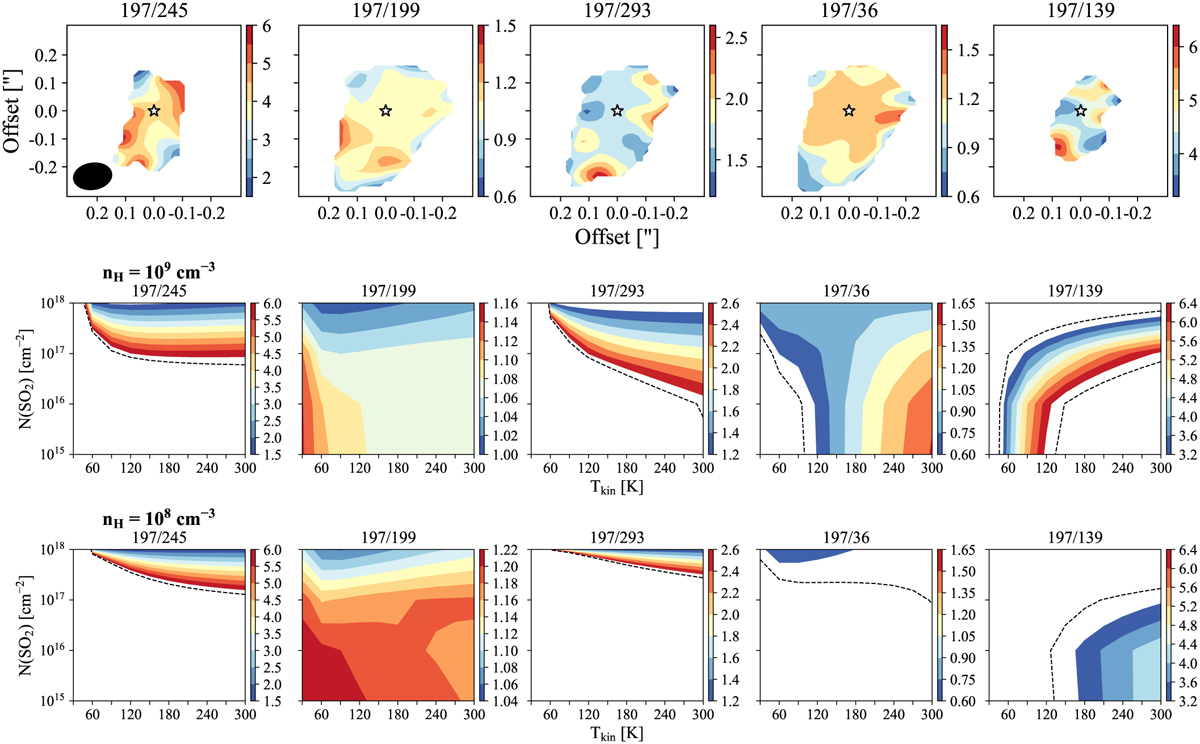
Comparison between observed intensity ratios and RADEX models. Top: Observed intensity ratios between SO2 184.14–183.15 (Eup = 197 K) and the other five transitions, above a 3σ level. The synthesized beam is shown by the black filled ellipse in the bottom left corner of the first panel and the yellow star indicates the position of the source. Center: Intensity ratios from RADEX for the same transitions and employing a H2 number density of 109 cm−3. Bottom: Same analysis from RADEX, but employing a H2 number density of 108 cm−3. The black dashed contours indicate error values oiler and the limits of the possible ranges. All values are possible for the panels without black dashed contours.
Current usage metrics show cumulative count of Article Views (full-text article views including HTML views, PDF and ePub downloads, according to the available data) and Abstracts Views on Vision4Press platform.
Data correspond to usage on the plateform after 2015. The current usage metrics is available 48-96 hours after online publication and is updated daily on week days.
Initial download of the metrics may take a while.