Fig. A.4
Download original image
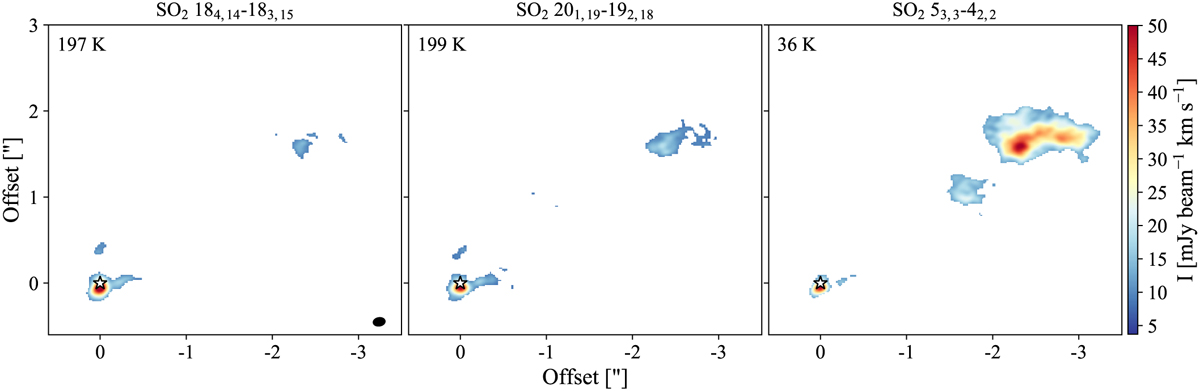
Large-scale emission. Moment 0 maps of SO2 integrated over a velocity range of 2 km s−1 and above 1σ. The white star shows the position of the source and the synthesized beam is indicated by the black filled ellipse in the bottom right corner of the first panel. The Eup value of each transition is indicated in the top left corner of each panel and the color scale is the same for all three panels.
Current usage metrics show cumulative count of Article Views (full-text article views including HTML views, PDF and ePub downloads, according to the available data) and Abstracts Views on Vision4Press platform.
Data correspond to usage on the plateform after 2015. The current usage metrics is available 48-96 hours after online publication and is updated daily on week days.
Initial download of the metrics may take a while.