Fig. A.2
Download original image
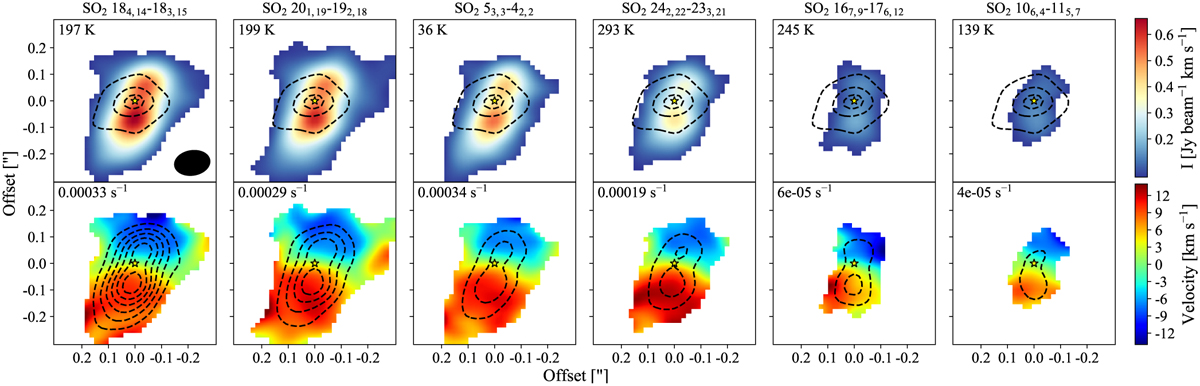
Small-scale emission. Top: Moment 0 maps of SO2 above 3σ (color scale) and continuum emission (dashed contours). The moment 0 maps were integrated over 60 km s−1 and the continuum contours start at 20σ and follow steps of 80σ. The Eup value of each transition is indicated in the top left corner of each panel and the synthesized beam is shown by the black filled ellipse in the bottom right corner of the first panel. The color scale is the same for the six panels. Bottom: Moment 1 maps of SO2 above 3σ (color scale) and selected values of their respective moment 0 maps (dashed contours). The contours start at 3σ and follow steps of 7σ, with the exception of the last two panels, which follow steps of 3σ. The Ay value of each transition is indicated in the top left corner of each panel; the color scale is the same for the six panels. The adopted systemic velocity is 3.7 km s−1.
Current usage metrics show cumulative count of Article Views (full-text article views including HTML views, PDF and ePub downloads, according to the available data) and Abstracts Views on Vision4Press platform.
Data correspond to usage on the plateform after 2015. The current usage metrics is available 48-96 hours after online publication and is updated daily on week days.
Initial download of the metrics may take a while.