Open Access
Fig. A.1
Download original image
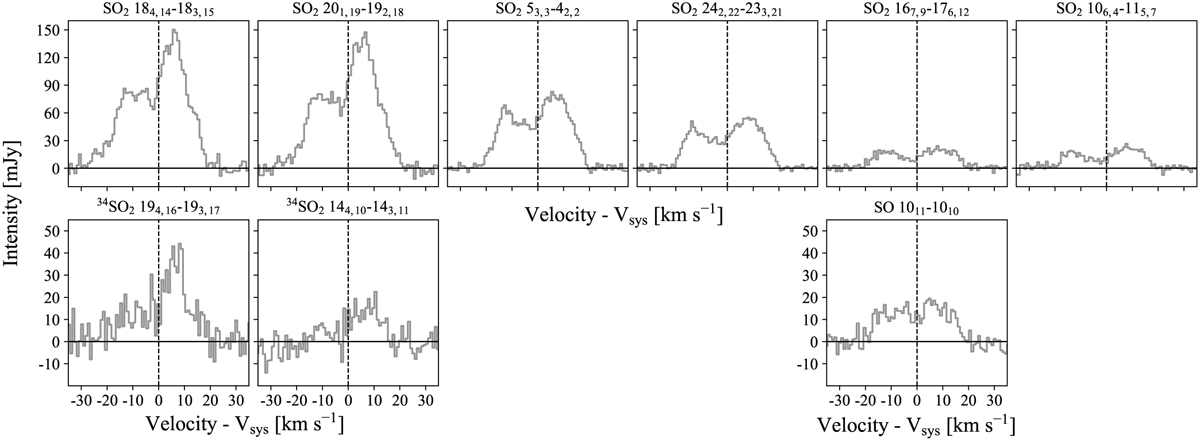
Spectra of SO2 (top), 34SO2 (bottom left), and SO (bottom right), integrated over a circular region with r = 0″.2 and centered on the continuum peak position. The systemic velocity corresponds to 3.7 km s−1.
Current usage metrics show cumulative count of Article Views (full-text article views including HTML views, PDF and ePub downloads, according to the available data) and Abstracts Views on Vision4Press platform.
Data correspond to usage on the plateform after 2015. The current usage metrics is available 48-96 hours after online publication and is updated daily on week days.
Initial download of the metrics may take a while.