Fig. 1
Download original image
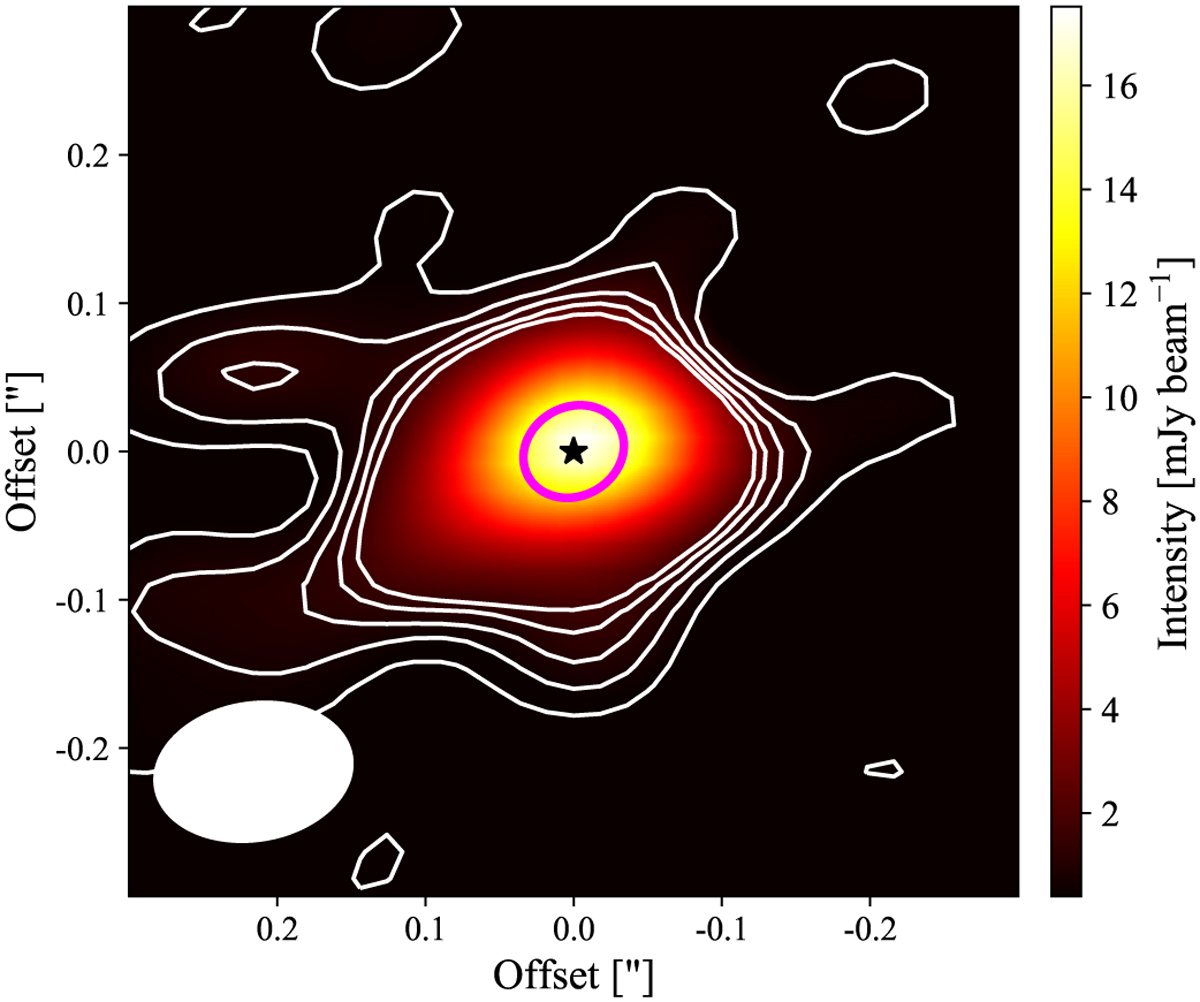
Continuum emission (0.87 mm) toward IRS 44 above 5σ (σ = 0.08 mJy beam−1). The white contours represent the weakest emission of [5, 10, 15, 20, and 25σ] for clarity. The black star shows the position of the continuum peak and the synthesized beam is indicated by the white filled ellipse. The magenta ellipse represents the deconvolved size from the 2D Gaussian fit.
Current usage metrics show cumulative count of Article Views (full-text article views including HTML views, PDF and ePub downloads, according to the available data) and Abstracts Views on Vision4Press platform.
Data correspond to usage on the plateform after 2015. The current usage metrics is available 48-96 hours after online publication and is updated daily on week days.
Initial download of the metrics may take a while.