Fig. 7.
Download original image
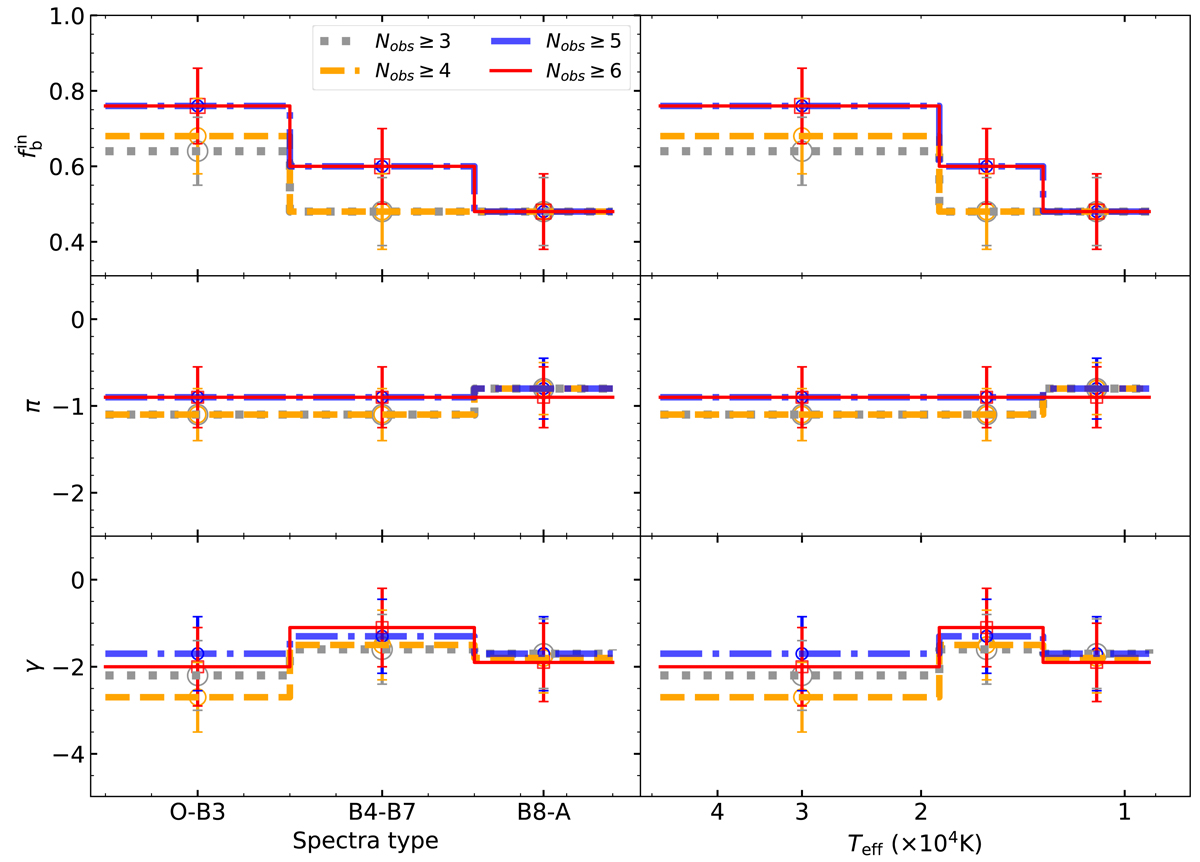
Intrinsic statistical properties of ![]() , π, and γ for stars with observational frequencies greater than 3, 4, 5, and 6 in groups of classification based on Teff. The x-axis in the left panel is based on spectra type, while in the right panel it is based on Teff. Top panel: represents the trend of
, π, and γ for stars with observational frequencies greater than 3, 4, 5, and 6 in groups of classification based on Teff. The x-axis in the left panel is based on spectra type, while in the right panel it is based on Teff. Top panel: represents the trend of ![]() , and the middle (bottom) represents the trend of π (γ). The blue dot-dashed and red solid lines represent the results of stars classified based upon Teff in groups of B8-A, B4-B7, and O-B3 with observational frequencies greater than five and six, respectively, while the gray and yellow dashed lines represent frequencies greater than three and four.
, and the middle (bottom) represents the trend of π (γ). The blue dot-dashed and red solid lines represent the results of stars classified based upon Teff in groups of B8-A, B4-B7, and O-B3 with observational frequencies greater than five and six, respectively, while the gray and yellow dashed lines represent frequencies greater than three and four.
Current usage metrics show cumulative count of Article Views (full-text article views including HTML views, PDF and ePub downloads, according to the available data) and Abstracts Views on Vision4Press platform.
Data correspond to usage on the plateform after 2015. The current usage metrics is available 48-96 hours after online publication and is updated daily on week days.
Initial download of the metrics may take a while.