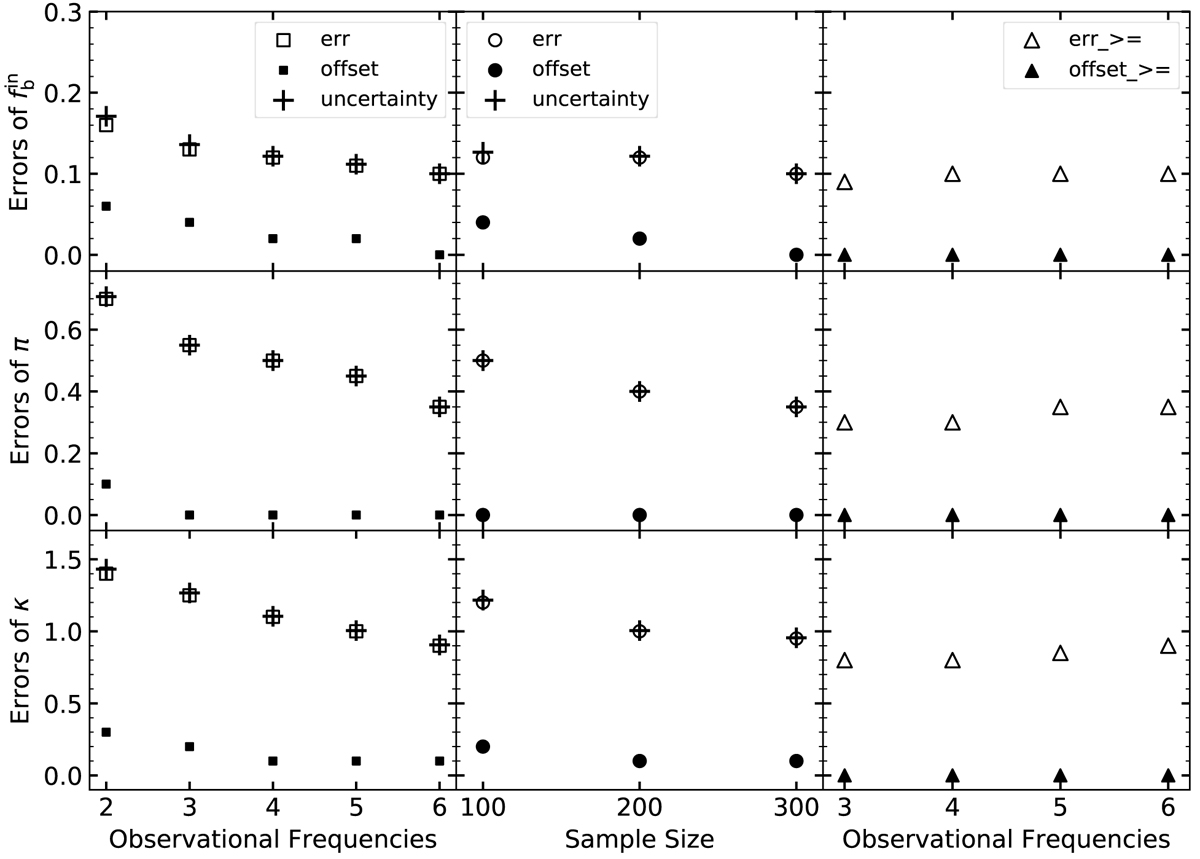
Fig. 6.
Download original image
Uncertainties for the different samples. Left panel: open and filled squares represent the error and offset of the same sample of stars, but with different observational frequencies. The plus signs represent uncertainties. Middle panel: open and filled circles represent the error and offset of the same observational frequencies sample of stars, but with different sample sizes. The plus signs represent uncertainties. Right panel: open and filled triangles represent the error and offset of the actual samples. The uncertainties are not shown because they have the same values as the errors.
Current usage metrics show cumulative count of Article Views (full-text article views including HTML views, PDF and ePub downloads, according to the available data) and Abstracts Views on Vision4Press platform.
Data correspond to usage on the plateform after 2015. The current usage metrics is available 48-96 hours after online publication and is updated daily on week days.
Initial download of the metrics may take a while.