Fig. 2.
Download original image
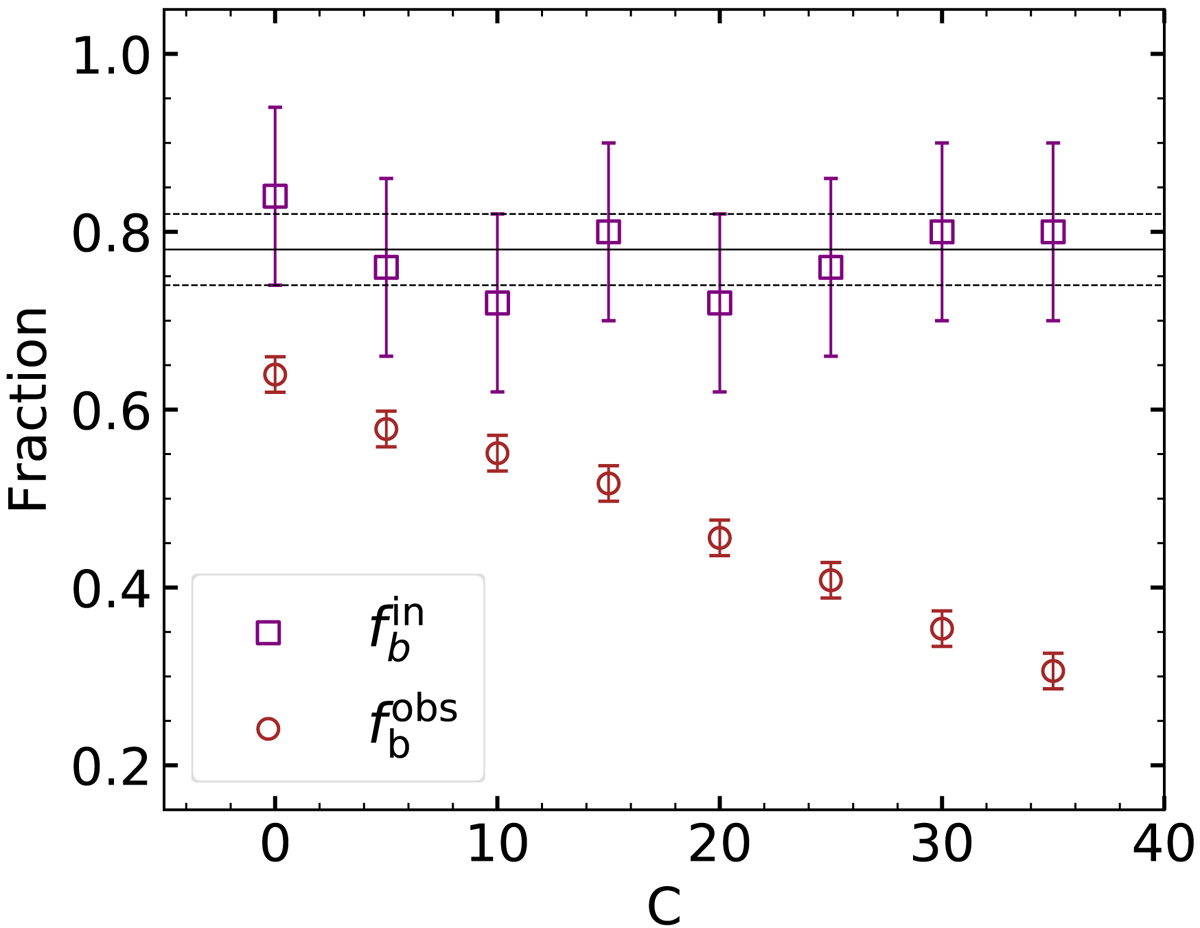
Variations in the binary fraction of observation (![]() ) and simulation (
) and simulation (![]() ) filtering from a set of different C values. The red circles and squares represent the binary fraction of the observation and the intrinsic binary fraction after Monte Carlo simulation correction, respectively. The gray dashed and solid lines represent the mean and standard deviation of these
) filtering from a set of different C values. The red circles and squares represent the binary fraction of the observation and the intrinsic binary fraction after Monte Carlo simulation correction, respectively. The gray dashed and solid lines represent the mean and standard deviation of these ![]() , respectively.
, respectively.
Current usage metrics show cumulative count of Article Views (full-text article views including HTML views, PDF and ePub downloads, according to the available data) and Abstracts Views on Vision4Press platform.
Data correspond to usage on the plateform after 2015. The current usage metrics is available 48-96 hours after online publication and is updated daily on week days.
Initial download of the metrics may take a while.