Open Access
Fig. 1.
Download original image
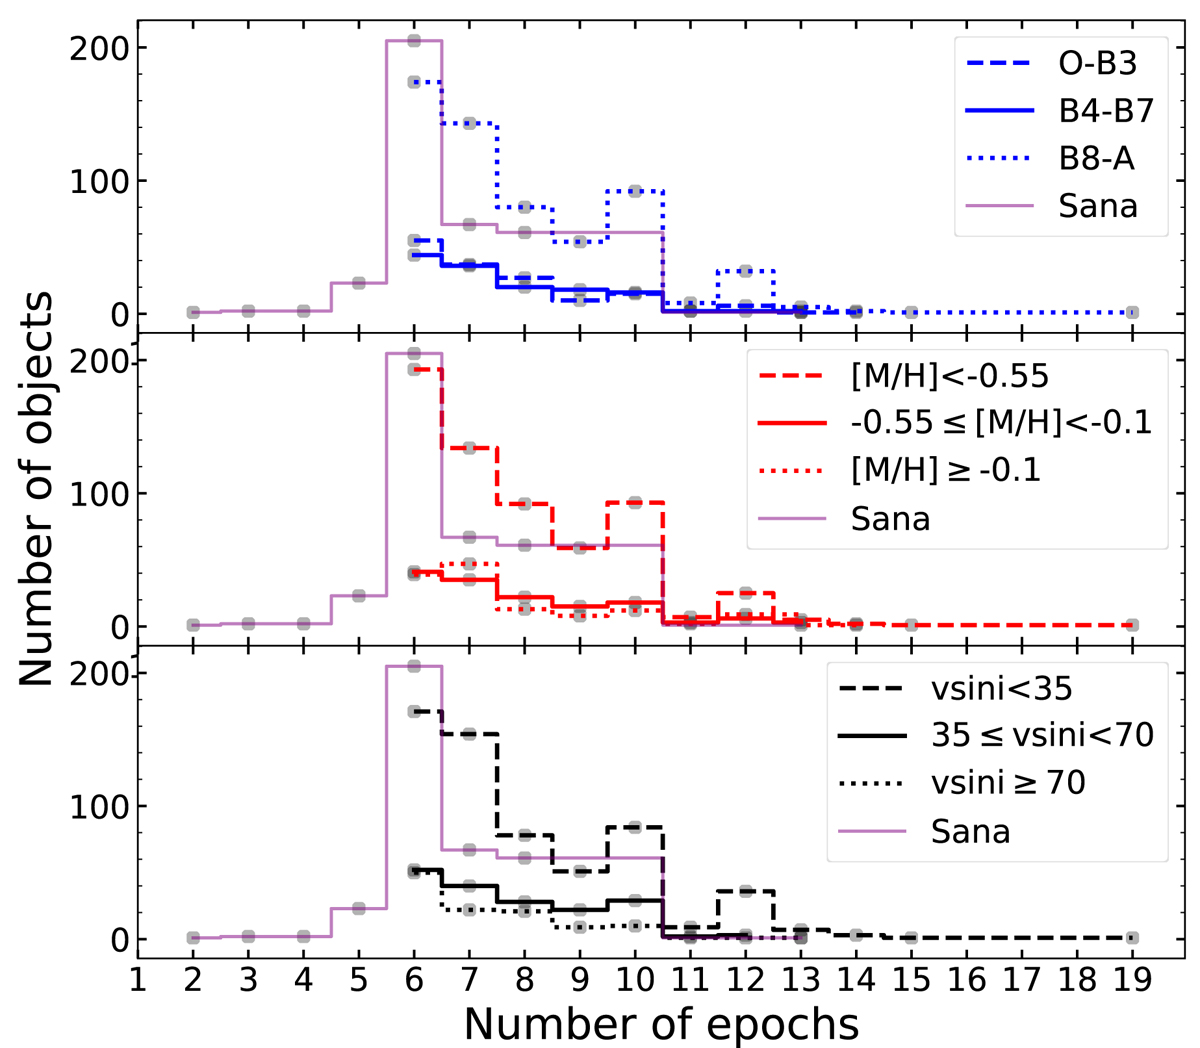
Number distribution for different groups based on Teff (top panel), [M/H] (middle panel), and vsini (bottom panel). The solid purple line represents the observations of samples from Sana et al. (2013) in which about 93% of the sample are from more than six observations.
Current usage metrics show cumulative count of Article Views (full-text article views including HTML views, PDF and ePub downloads, according to the available data) and Abstracts Views on Vision4Press platform.
Data correspond to usage on the plateform after 2015. The current usage metrics is available 48-96 hours after online publication and is updated daily on week days.
Initial download of the metrics may take a while.