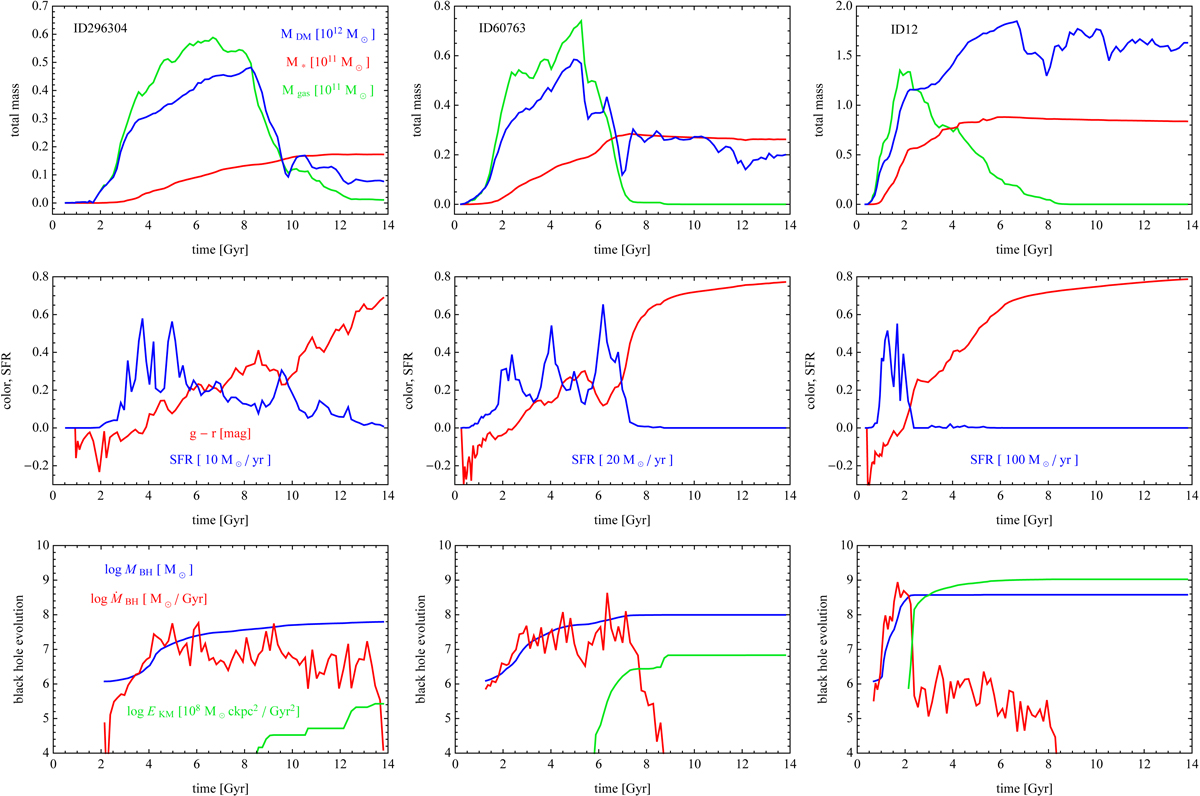
Fig. 2.
Download original image
Evolution of representative examples of red disk galaxies. The columns present the results for different galaxies: ID296304, ID60763, and ID12. Upper row: evolution of the total dark, stellar, and gas mass shown with the blue, red, and green lines, respectively. Middle row: evolution of color (red line) and SFR (blue). Lower row: evolution of the mass of the central supermassive black hole (blue), its accretion rate (red), and the cumulative AGN feedback energy injected into the surrounding gas in the kinetic mode (green). The units are as in the left column unless noted otherwise.
Current usage metrics show cumulative count of Article Views (full-text article views including HTML views, PDF and ePub downloads, according to the available data) and Abstracts Views on Vision4Press platform.
Data correspond to usage on the plateform after 2015. The current usage metrics is available 48-96 hours after online publication and is updated daily on week days.
Initial download of the metrics may take a while.