Fig. 1
Download original image
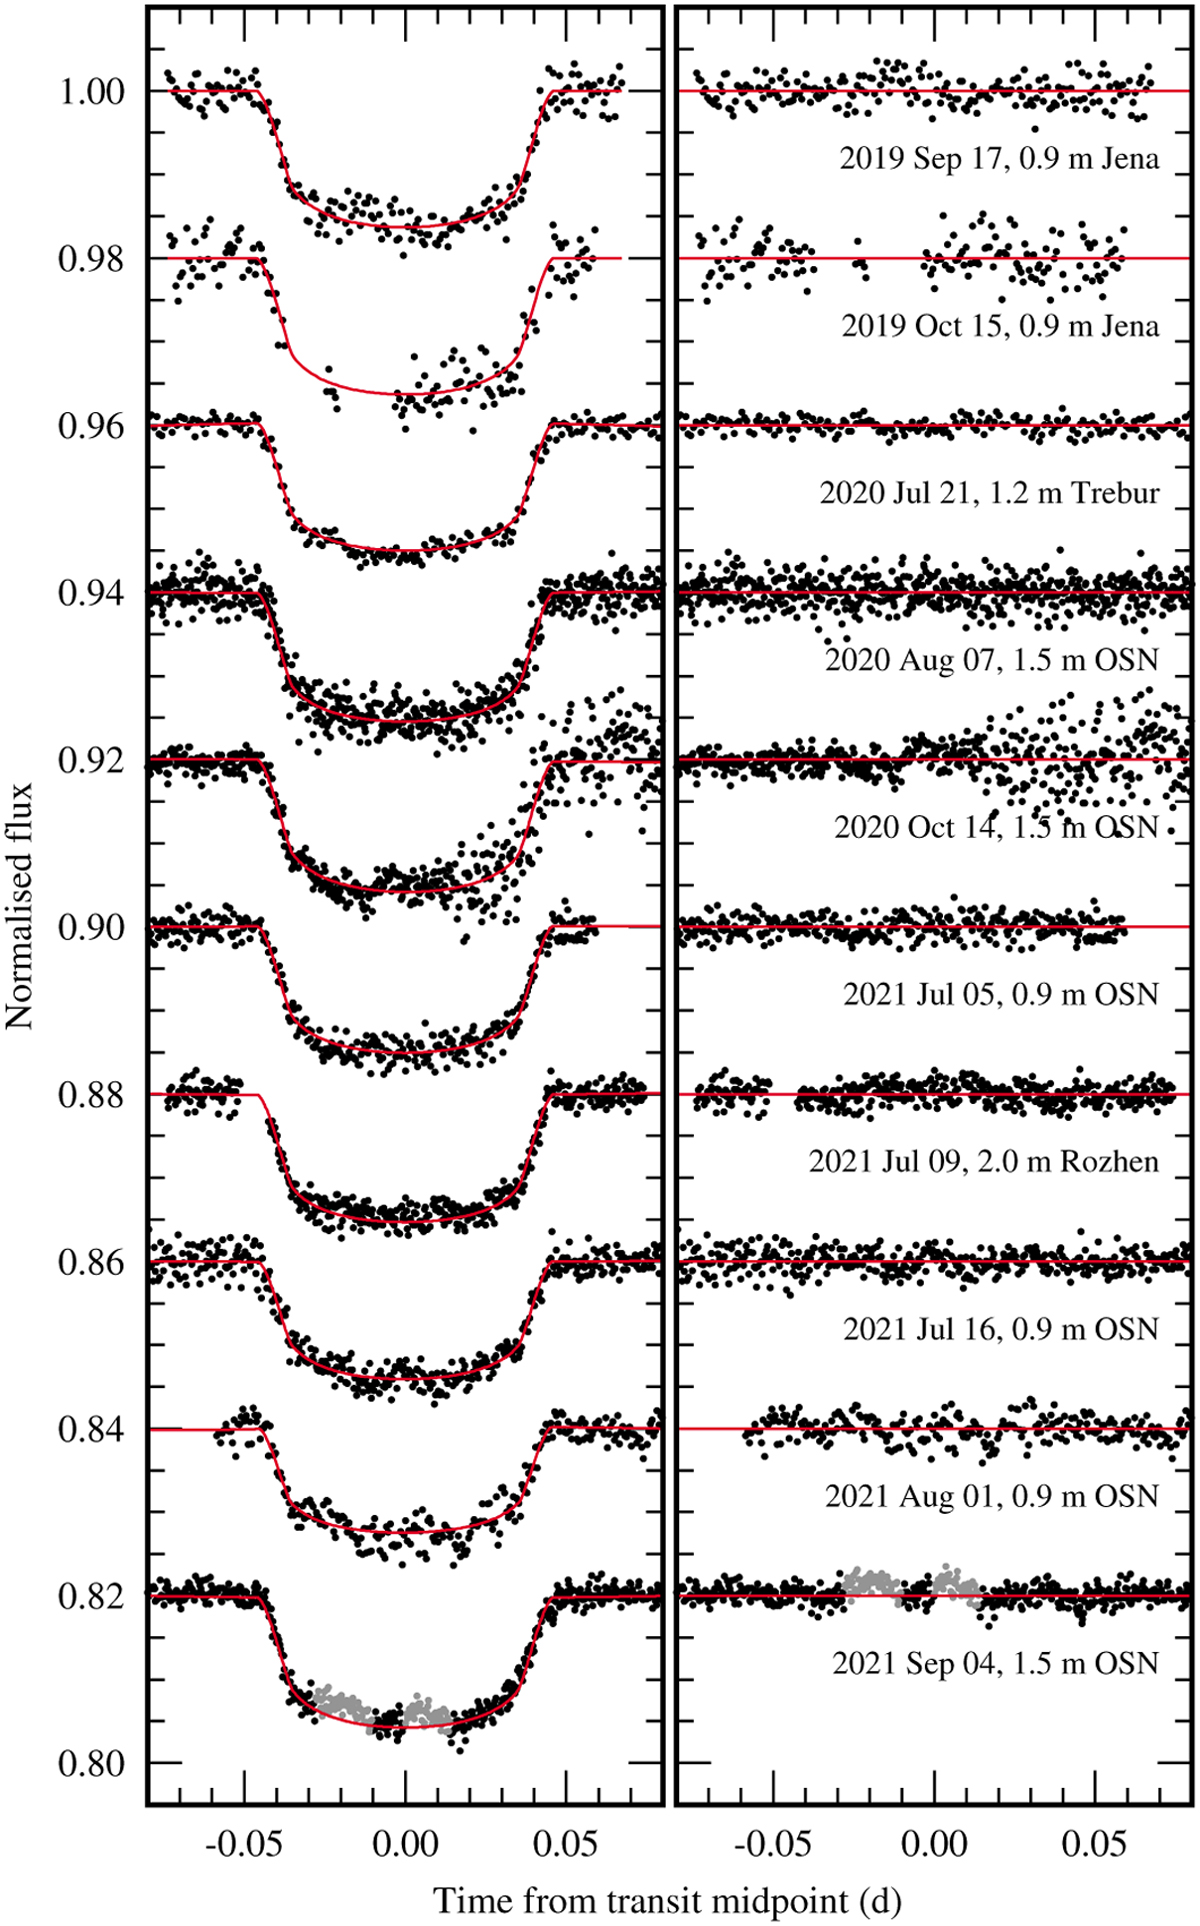
New ground-based transit light curves for HAT-P-23 b. Left: individual photometric time series sorted by the observation date. The best-fitting model is drawn with red lines. A signature of star-spot occultation identified in the light curve acquired on 2021 September 4 is marked with grey points. These measurements were masked out in the transit modelling. Right: photometric residuals from the transit model.
Current usage metrics show cumulative count of Article Views (full-text article views including HTML views, PDF and ePub downloads, according to the available data) and Abstracts Views on Vision4Press platform.
Data correspond to usage on the plateform after 2015. The current usage metrics is available 48-96 hours after online publication and is updated daily on week days.
Initial download of the metrics may take a while.