Fig. 8.
Download original image
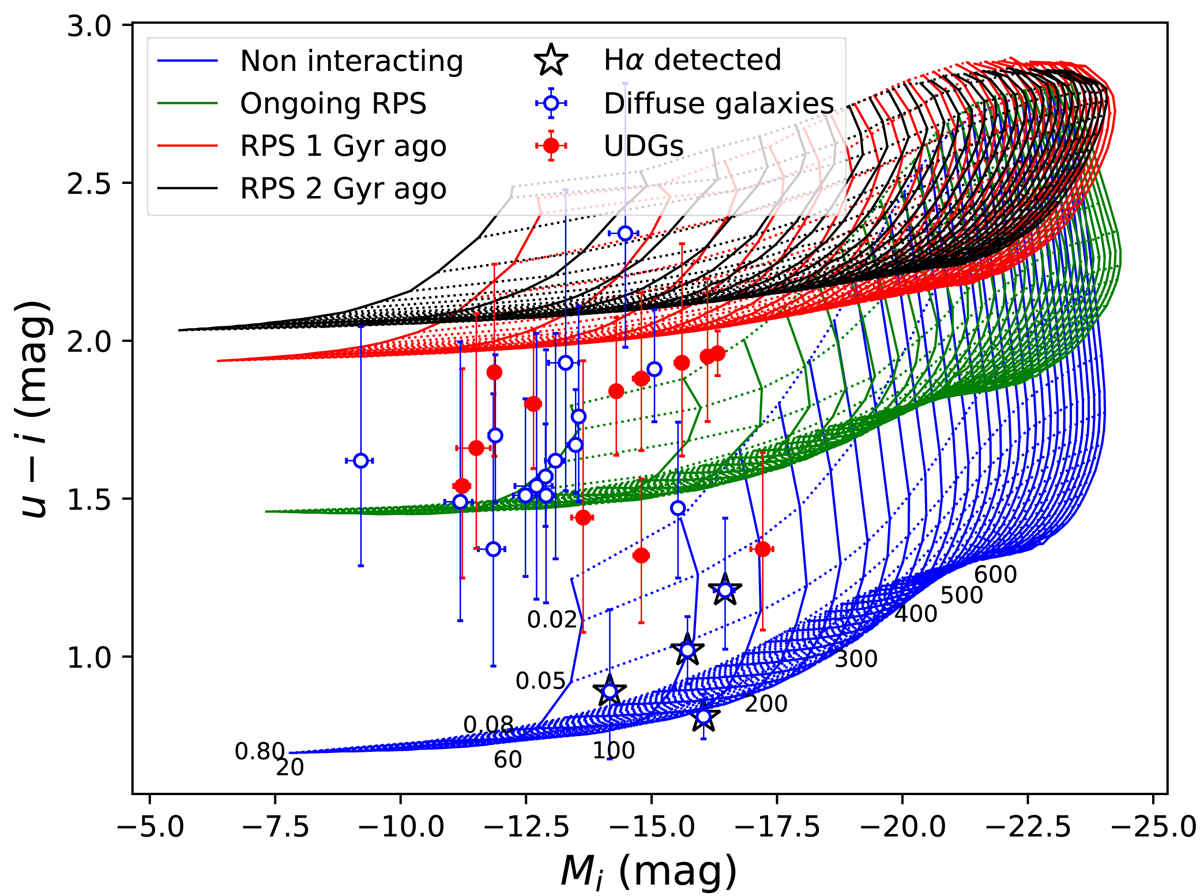
u − i color versus the i-band absolute magnitude of the sample in comparison with the grid of colors from the models discussed in Sects. 6.1 and 6.2. The UDGs and the diffuse galaxy subsamples are marked with the filled red and open blue circles, respectively. The black star symbols are the sources detected in Hα. Sources with only an upper or lower limit in the color are excluded from the plot. The blue grid corresponds to galaxies without any environmental interaction (non-RPS models; see Sect. 6.1). The green, red, and black grids correspond to models with an RPS event at different epochs (ongoing, 1 Gyr ago, and 2 Gyr ago, respectively). The black labels marked along the blue are the different λ (0.01 to 0.80) and VC (20 km s−1 to 600 km s−1) values of the models, as given in Table 3. The dotted and solid lines in the grids give the variation for a fixed λ and VC, respectively.
Current usage metrics show cumulative count of Article Views (full-text article views including HTML views, PDF and ePub downloads, according to the available data) and Abstracts Views on Vision4Press platform.
Data correspond to usage on the plateform after 2015. The current usage metrics is available 48-96 hours after online publication and is updated daily on week days.
Initial download of the metrics may take a while.