Fig. 6.
Download original image
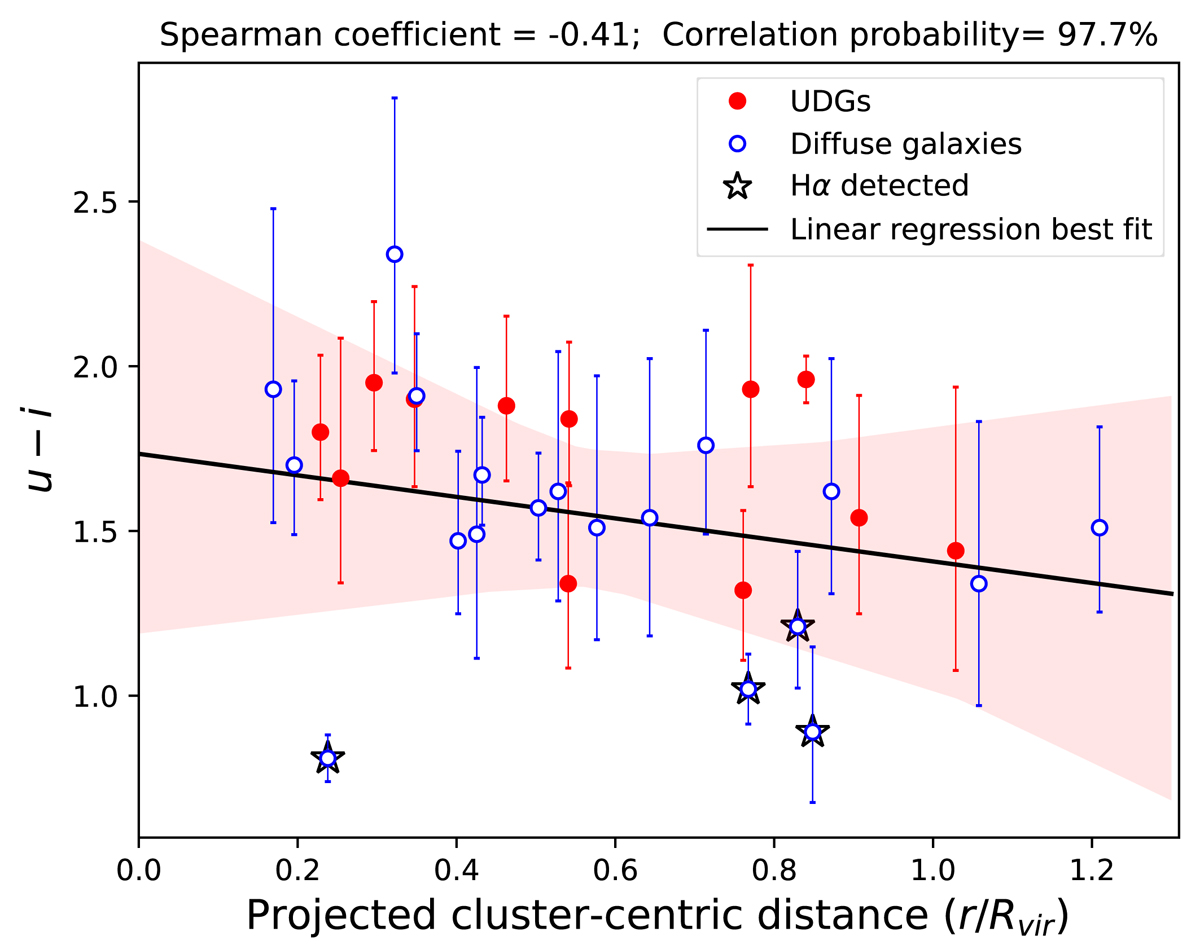
u − i color of the sample as a function of the projected distance from the Virgo cluster center (distance from M 87) in units of the cluster virial radius (Rvir = 1.55 Mpc; Ferrarese et al. 2012). The UDGs and the diffuse galaxy subsamples are marked with the filled red and open blue circles, respectively. The black star symbols are the sources detected in Hα (see Sect. 5.5). The solid black line and the red-shaded region give the linear regression best fit and the 3σ scatter, respectively, obtained using the linmix Python package (Kelly 2007). Sources with only an upper or lower limit in the color are excluded from the plot.
Current usage metrics show cumulative count of Article Views (full-text article views including HTML views, PDF and ePub downloads, according to the available data) and Abstracts Views on Vision4Press platform.
Data correspond to usage on the plateform after 2015. The current usage metrics is available 48-96 hours after online publication and is updated daily on week days.
Initial download of the metrics may take a while.