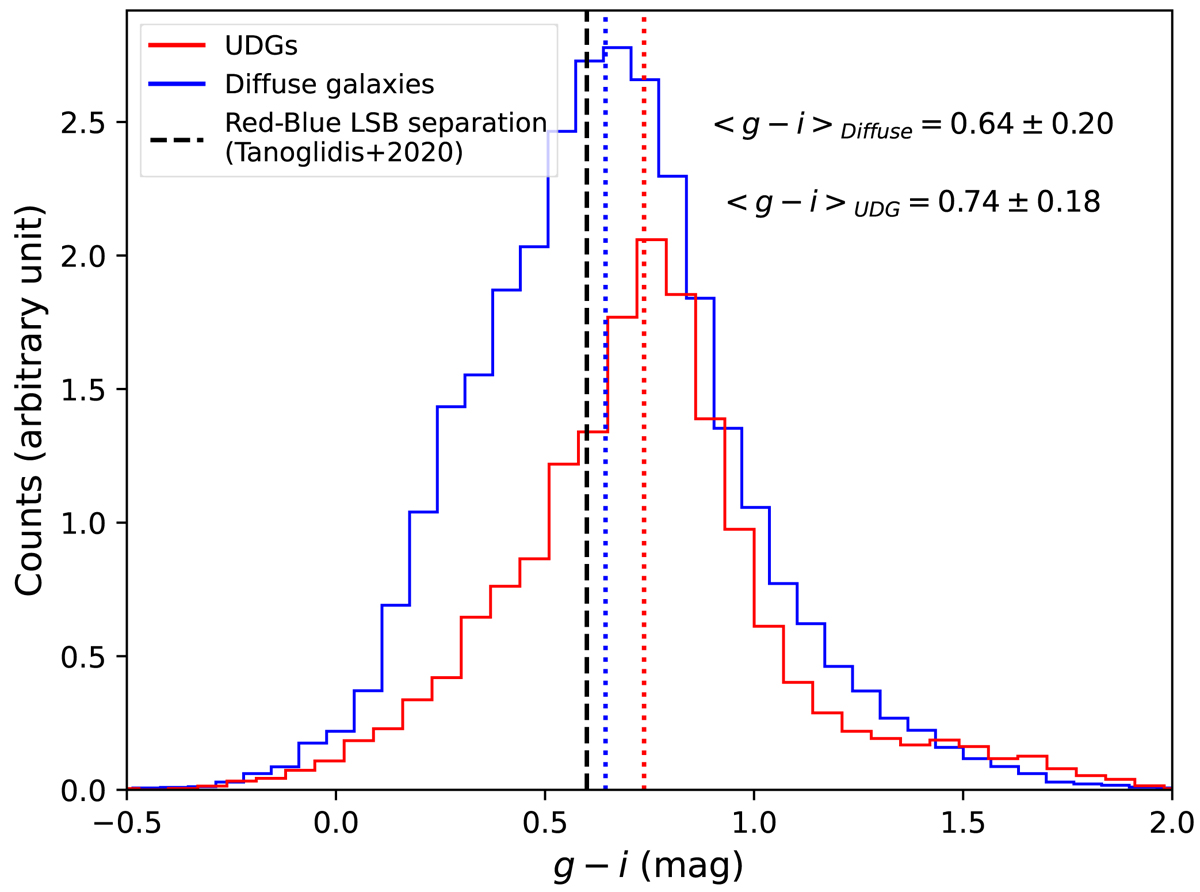
Fig. 5.
Download original image
Observed g − i color distribution of the sample after redistributing the galaxies within their uncertainties. The solid red and blue lines show the UDGs and diffuse galaxies, respectively, along with their median values (given at the top-right corner), marked as the dotted vertical lines. Sources with only upper limits on the color are removed from this distribution. The vertical dashed black line marks the separation of red and blue LSBs from Tanoglidis et al. (2021).
Current usage metrics show cumulative count of Article Views (full-text article views including HTML views, PDF and ePub downloads, according to the available data) and Abstracts Views on Vision4Press platform.
Data correspond to usage on the plateform after 2015. The current usage metrics is available 48-96 hours after online publication and is updated daily on week days.
Initial download of the metrics may take a while.