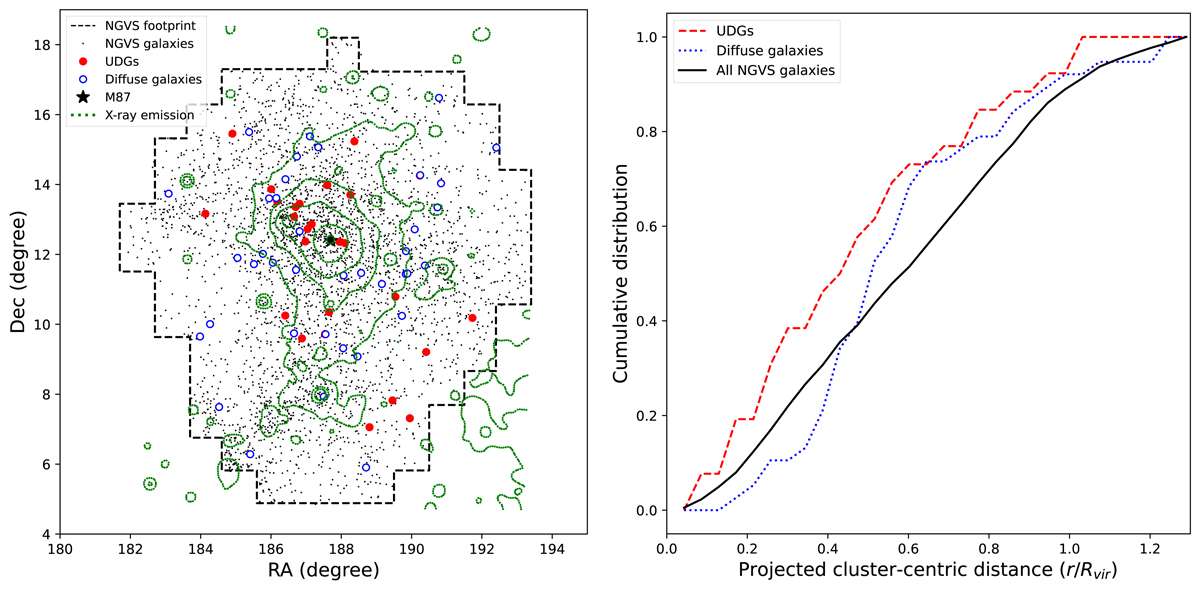
Fig. 4.
Download original image
Distribution of the sample within the Virgo cluster. Left: on-sky distribution of the selected sample of LSBs. The green contours mark the X-ray emission of the hot cluster gas obtained by ROSAT (Böhringer et al. 1994). Right: cumulative distribution of the projected cluster-centric distance of the galaxies in units of the cluster virial radius (Rvir = 1.55 Mpc; Ferrarese et al. 2012). The dashed red, dotted blue, and solid black lines are the UDGs, diffuse galaxies, and all the NGVS galaxies, respectively.
Current usage metrics show cumulative count of Article Views (full-text article views including HTML views, PDF and ePub downloads, according to the available data) and Abstracts Views on Vision4Press platform.
Data correspond to usage on the plateform after 2015. The current usage metrics is available 48-96 hours after online publication and is updated daily on week days.
Initial download of the metrics may take a while.