Fig. 3.
Download original image
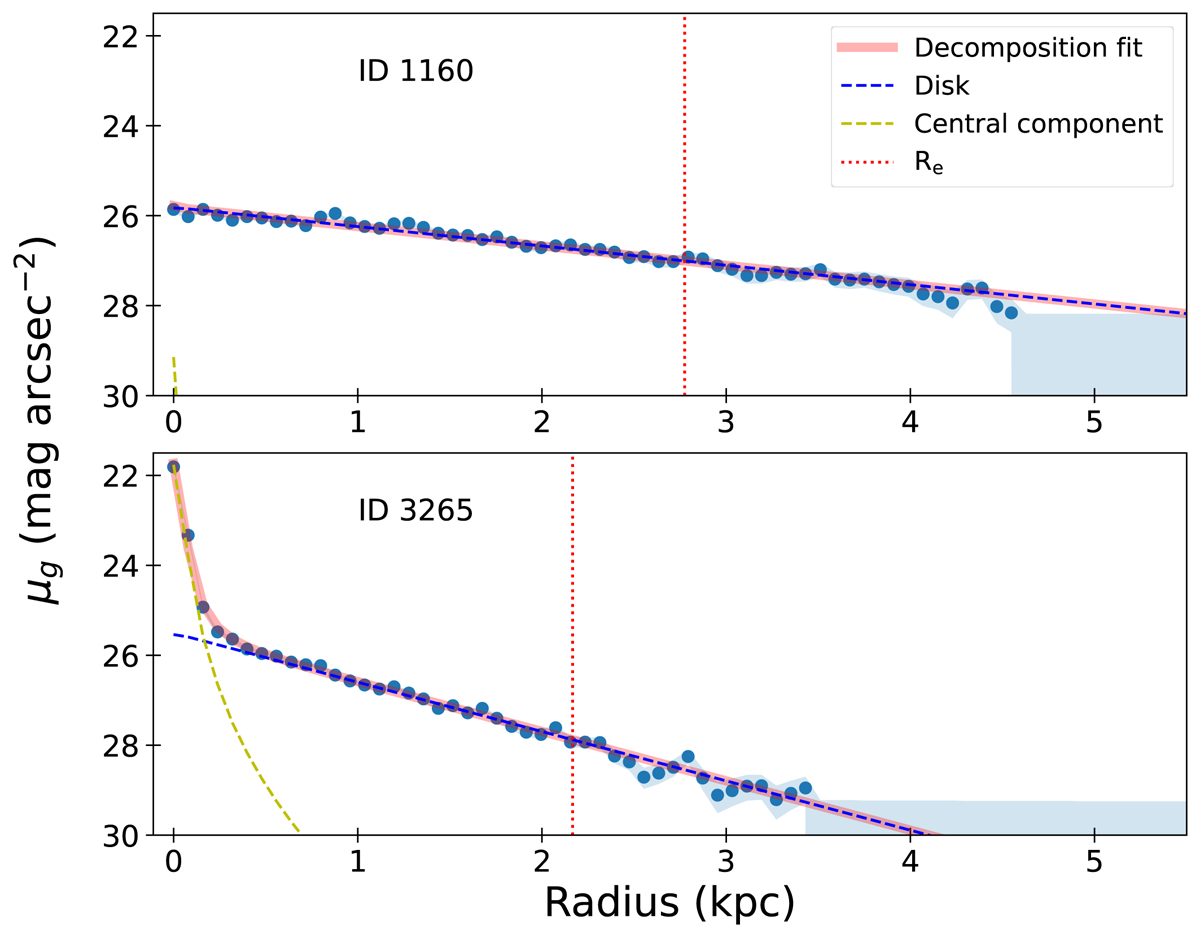
Example of the g-band surface-brightness profile decomposition of two sources from the sample, one with a pure exponential disk, more typical of our sample (top panel), and the other with a significant central component (bottom panel). The blue circles and the shaded areas are the observed data points and the 3σ upper limits, respectively. The dashed yellow, dashed blue, and solid red lines are, respectively, the Sérsic central component, the exponential disk, and the total best fit from the decomposition. The vertical dotted red line marks the effective radius of the galaxies.
Current usage metrics show cumulative count of Article Views (full-text article views including HTML views, PDF and ePub downloads, according to the available data) and Abstracts Views on Vision4Press platform.
Data correspond to usage on the plateform after 2015. The current usage metrics is available 48-96 hours after online publication and is updated daily on week days.
Initial download of the metrics may take a while.