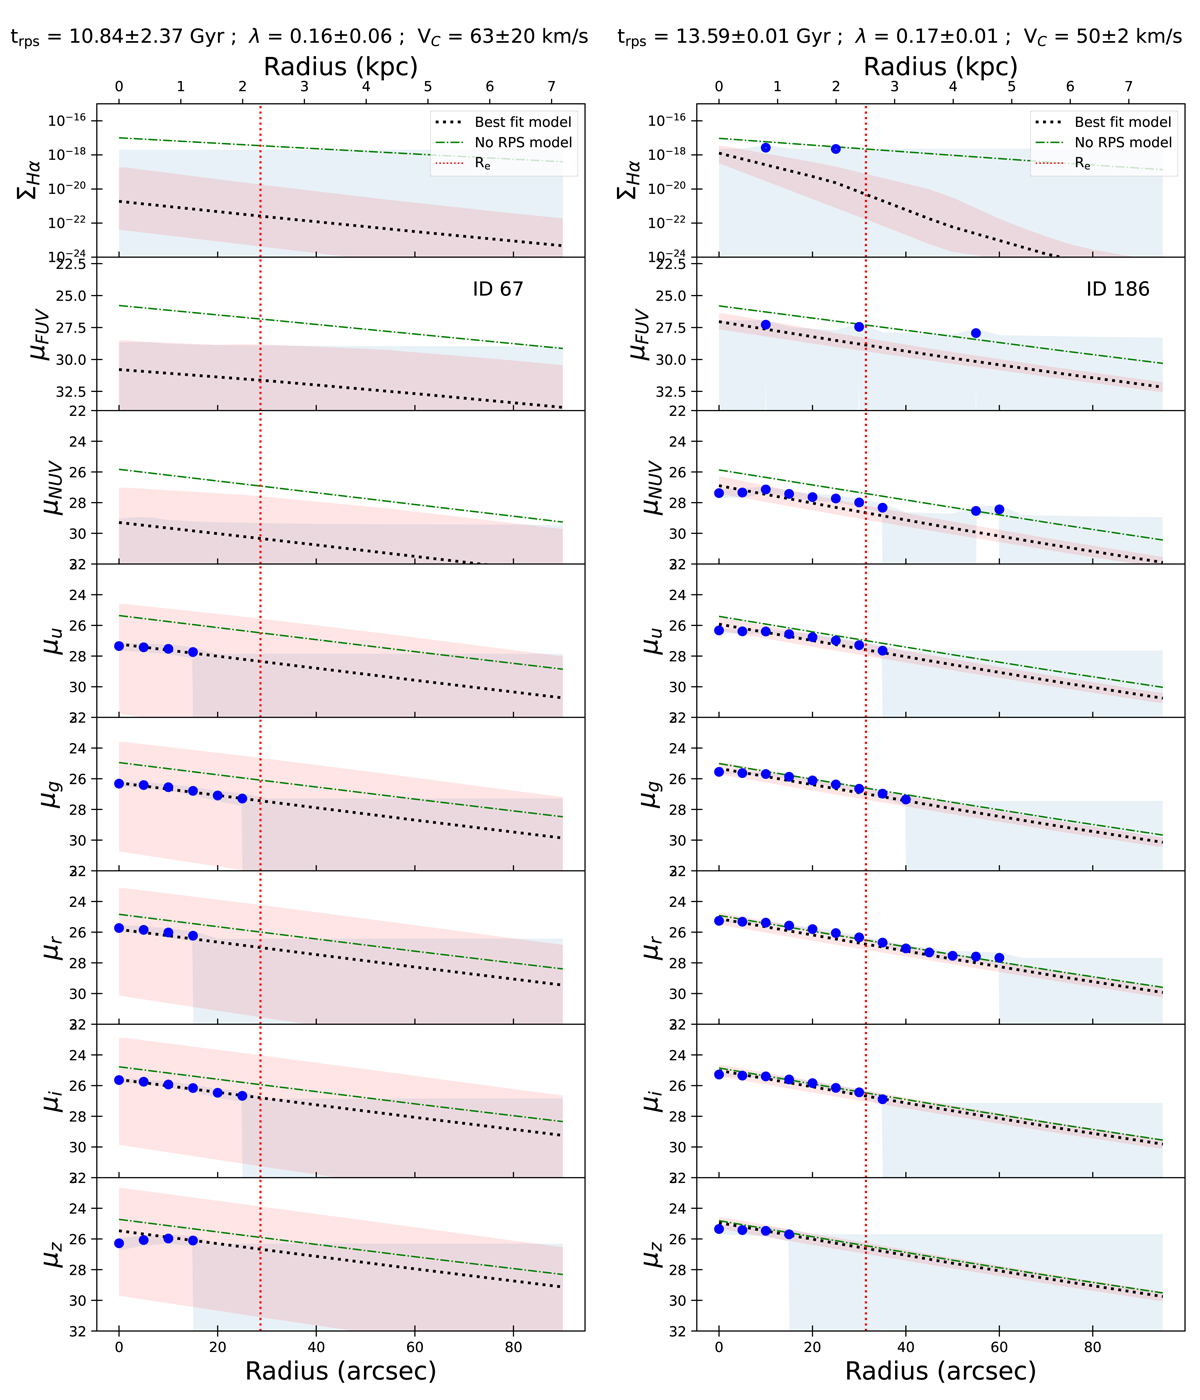
Fig. A.1.
Download original image
Radial surface-brightness profiles of all sources (blue filled dots) with their best-fit models (dotted black lines). The surface-brightness units are in mag arcsec−2 for all the bands except for Hα (erg s−1 cm−2 arcsec−2). The light-blue-shaded area marks the 1σ error (for data points) and upper limits (3σ). The dotted black line indicates the best-fit model derived as described in Sect. 6.4, with its 3σ confidence level (red-shaded area). The dot-dashed green line shows the same model for an unperturbed system (without RPS). The vertical dotted red line gives the g-band effective radius of the galaxy. The vertical gray-shaded regions shown for some galaxies are the regions excluded from the model fitting, where the disk is not dominant based on the decomposition discussed in Sect. 4.5. The profiles shown here are corrected for foreground Galactic extinction and inclination.
Current usage metrics show cumulative count of Article Views (full-text article views including HTML views, PDF and ePub downloads, according to the available data) and Abstracts Views on Vision4Press platform.
Data correspond to usage on the plateform after 2015. The current usage metrics is available 48-96 hours after online publication and is updated daily on week days.
Initial download of the metrics may take a while.