Fig. 10.
Download original image
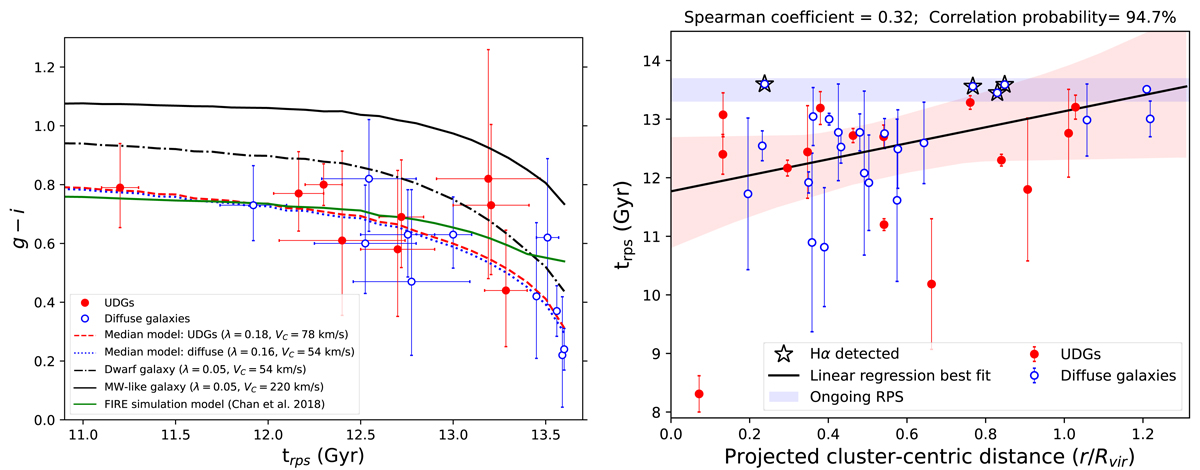
Comparision of the trps values with the observed color and the cluster-centric distance. Left: observed g − i color as a function of the best-fit trps value from the models. The dashed red and dotted blue curves show the model integrated g − i color for the median values of the UDGs and diffuse galaxies, respectively, as discussed in Sect. 6.5. The solid and dot-dashed black curves indicate the models for a representative dwarf and Milky Way-like galaxy, respectively (Boselli et al. 2014). The solid green line is the quenching time model for a red UDG from Chan et al. (2018) based on the FIRE simulation (see their Fig. 4, model m11b). Sources with only upper limits in the color or with trps uncertainty > 0.5 Gyr are excluded from this plot. This plot also does not include one galaxy (ID 2365), which has trps ≈ 8 Gyr, a large error bar in the color, and a very crowded field upon visual inspection. Right: trps values with respect to the projected distance from the cluster center, in units of the cluster virial radius (Rvir = 1.55 Mpc; Ferrarese et al. 2012). The blue-shaded area marks the region of ongoing RPS (trps between 13.3 and 13.7 Gyr). The solid black line and the red-shaded region give the linear regression best fit and the 3σ scatter, respectively, as given in Table 4. Sources with trps uncertainty > 2.5 Gyr are excluded from this plot.
Current usage metrics show cumulative count of Article Views (full-text article views including HTML views, PDF and ePub downloads, according to the available data) and Abstracts Views on Vision4Press platform.
Data correspond to usage on the plateform after 2015. The current usage metrics is available 48-96 hours after online publication and is updated daily on week days.
Initial download of the metrics may take a while.