Open Access
Fig. 9.
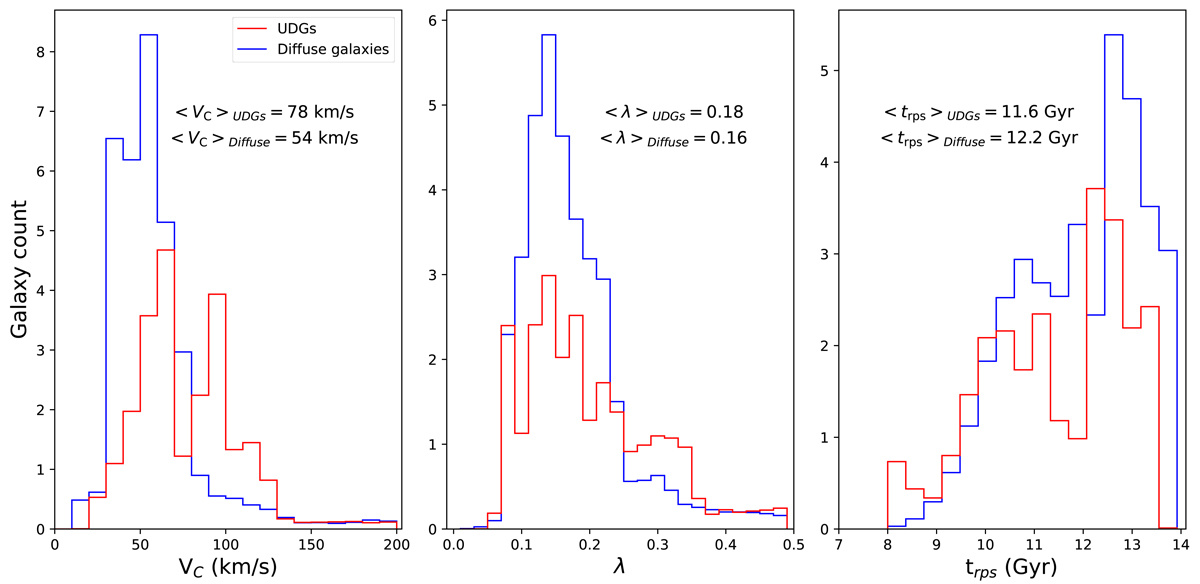
Download original image
Distribution of the VC, λ, and trps parameters from the best-fit models. The red and blue lines correspond to the UDG and diffuse galaxy subsamples, respectively. The median values corresponding to each parameter are shown within each panel.
Current usage metrics show cumulative count of Article Views (full-text article views including HTML views, PDF and ePub downloads, according to the available data) and Abstracts Views on Vision4Press platform.
Data correspond to usage on the plateform after 2015. The current usage metrics is available 48-96 hours after online publication and is updated daily on week days.
Initial download of the metrics may take a while.