Fig. 1.
Download original image
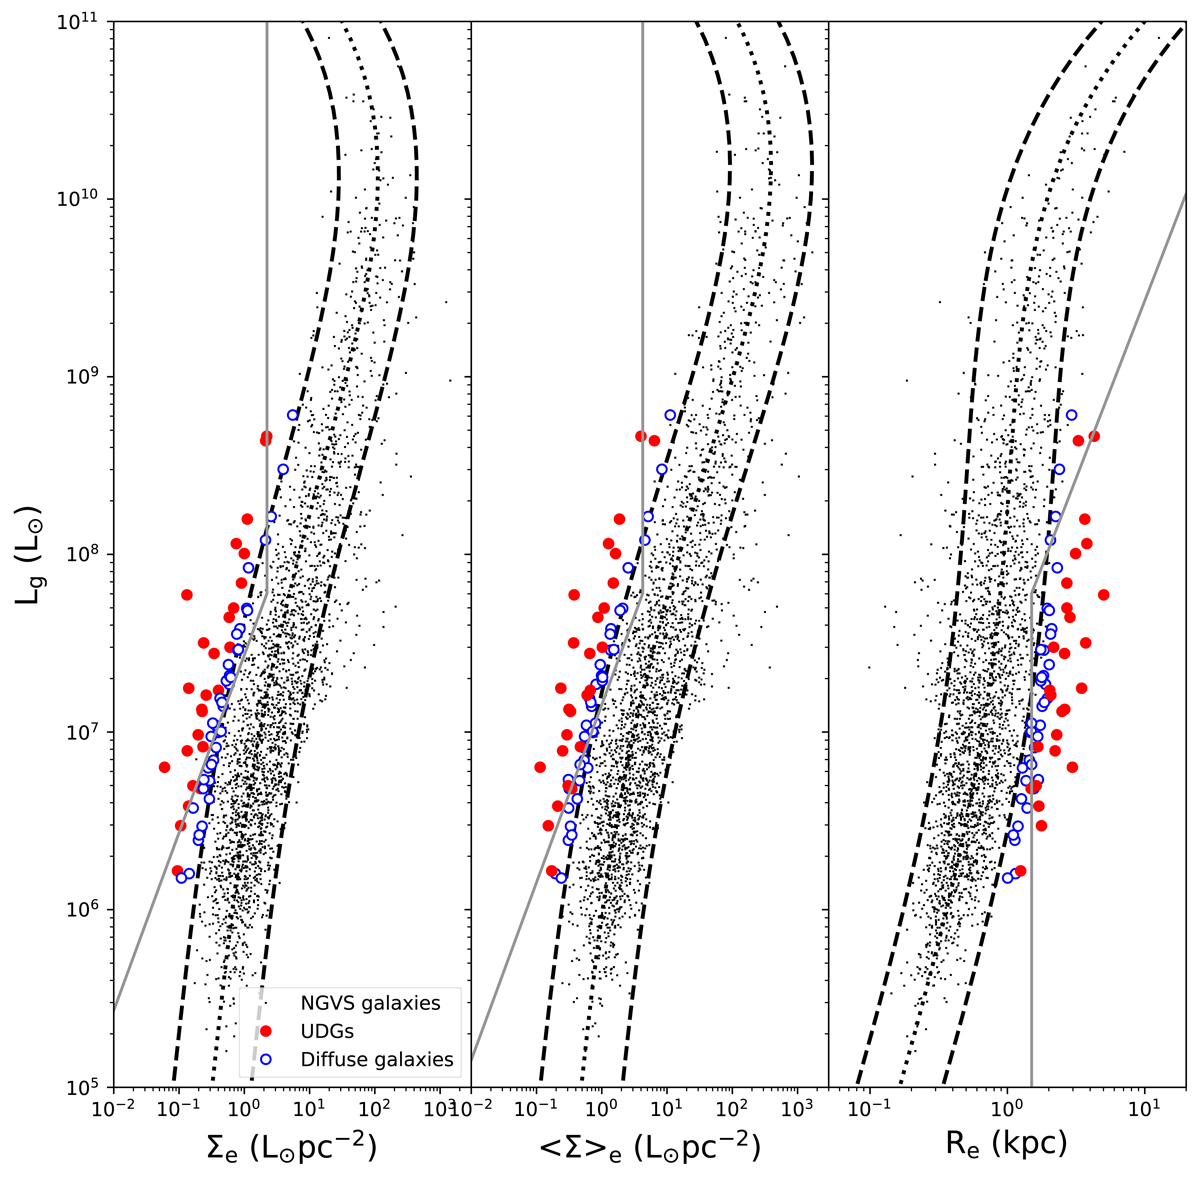
Scaling relations for the Virgo cluster galaxies (in the g band). In the three panels from left to right, the luminosity (Lg) is plotted with respect to the surface brightness at the effective radius (Σe), the mean surface brightness within the effective radius (⟨Σ⟩e), and the effective radius (Re), respectively. The black dots are all the galaxies in the NGVS catalog. The filled red and open blue circles show the selected samples of UDGs and diffuse galaxies, respectively. The dotted and dashed black curves show the mean scaling relations and their 2σ confidence limits, respectively, based on Lim et al. (2020). The solid gray line marks the UDG selection cut of van Dokkum et al. (2015) with μ0, g > 24 mag arcsec−2 and Re, g > 1.5 kpc for comparison.
Current usage metrics show cumulative count of Article Views (full-text article views including HTML views, PDF and ePub downloads, according to the available data) and Abstracts Views on Vision4Press platform.
Data correspond to usage on the plateform after 2015. The current usage metrics is available 48-96 hours after online publication and is updated daily on week days.
Initial download of the metrics may take a while.