Open Access
Fig. 7
Download original image
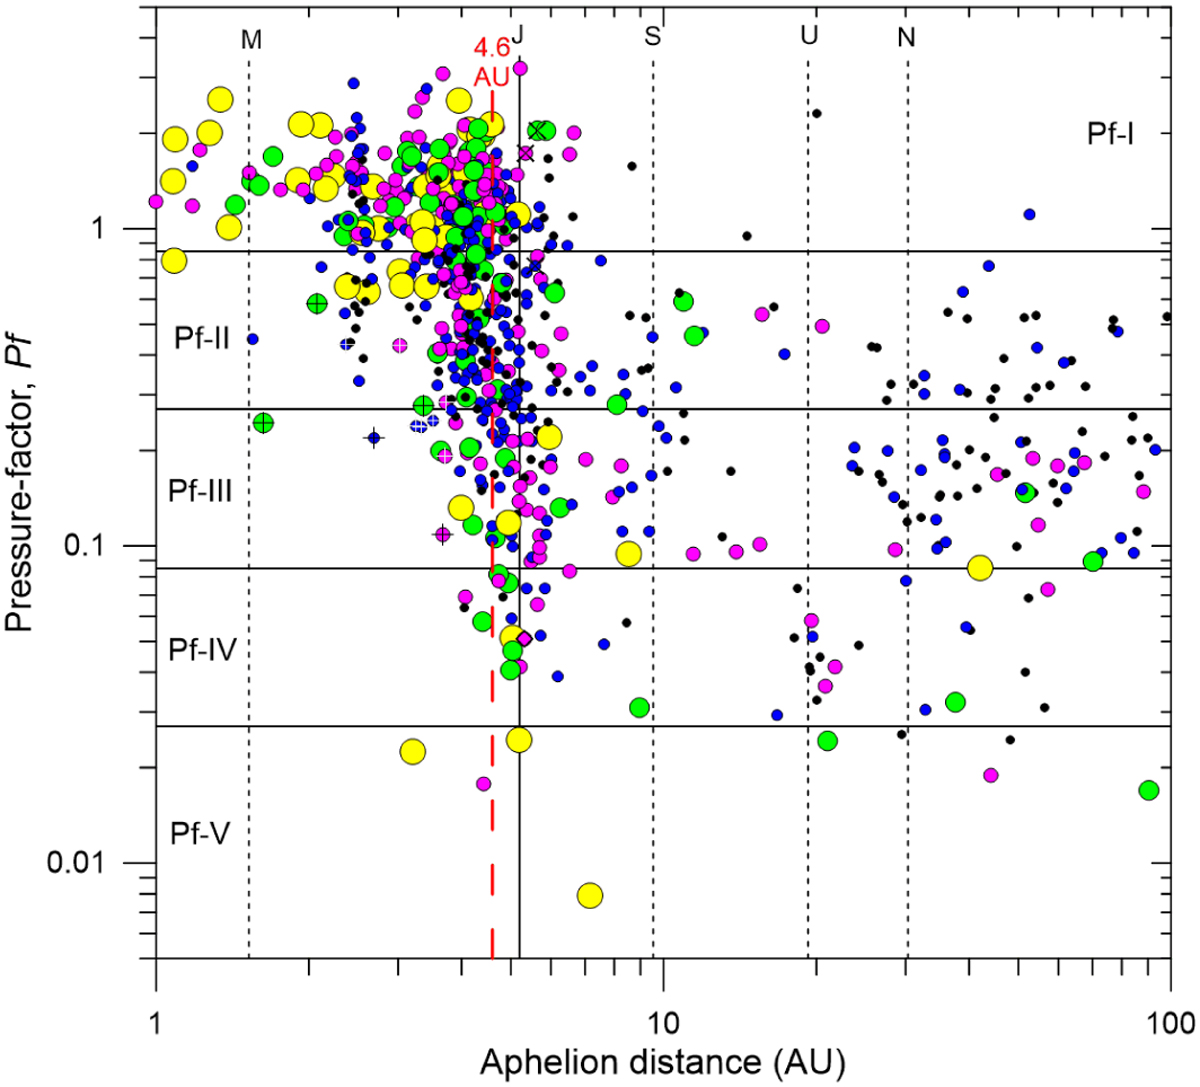
Pressure factor as a function of aphelion distance. Fireballs with an aphelion distance larger than 100 AU are not shown. Meteoroid masses and spectra are marked as in Fig. 4. Vertical black lines indicate the semimajor axes of planets from Mars to Neptune. The dashed red line is drawn at 4.6 AU.
Current usage metrics show cumulative count of Article Views (full-text article views including HTML views, PDF and ePub downloads, according to the available data) and Abstracts Views on Vision4Press platform.
Data correspond to usage on the plateform after 2015. The current usage metrics is available 48-96 hours after online publication and is updated daily on week days.
Initial download of the metrics may take a while.