Fig. 19
Download original image
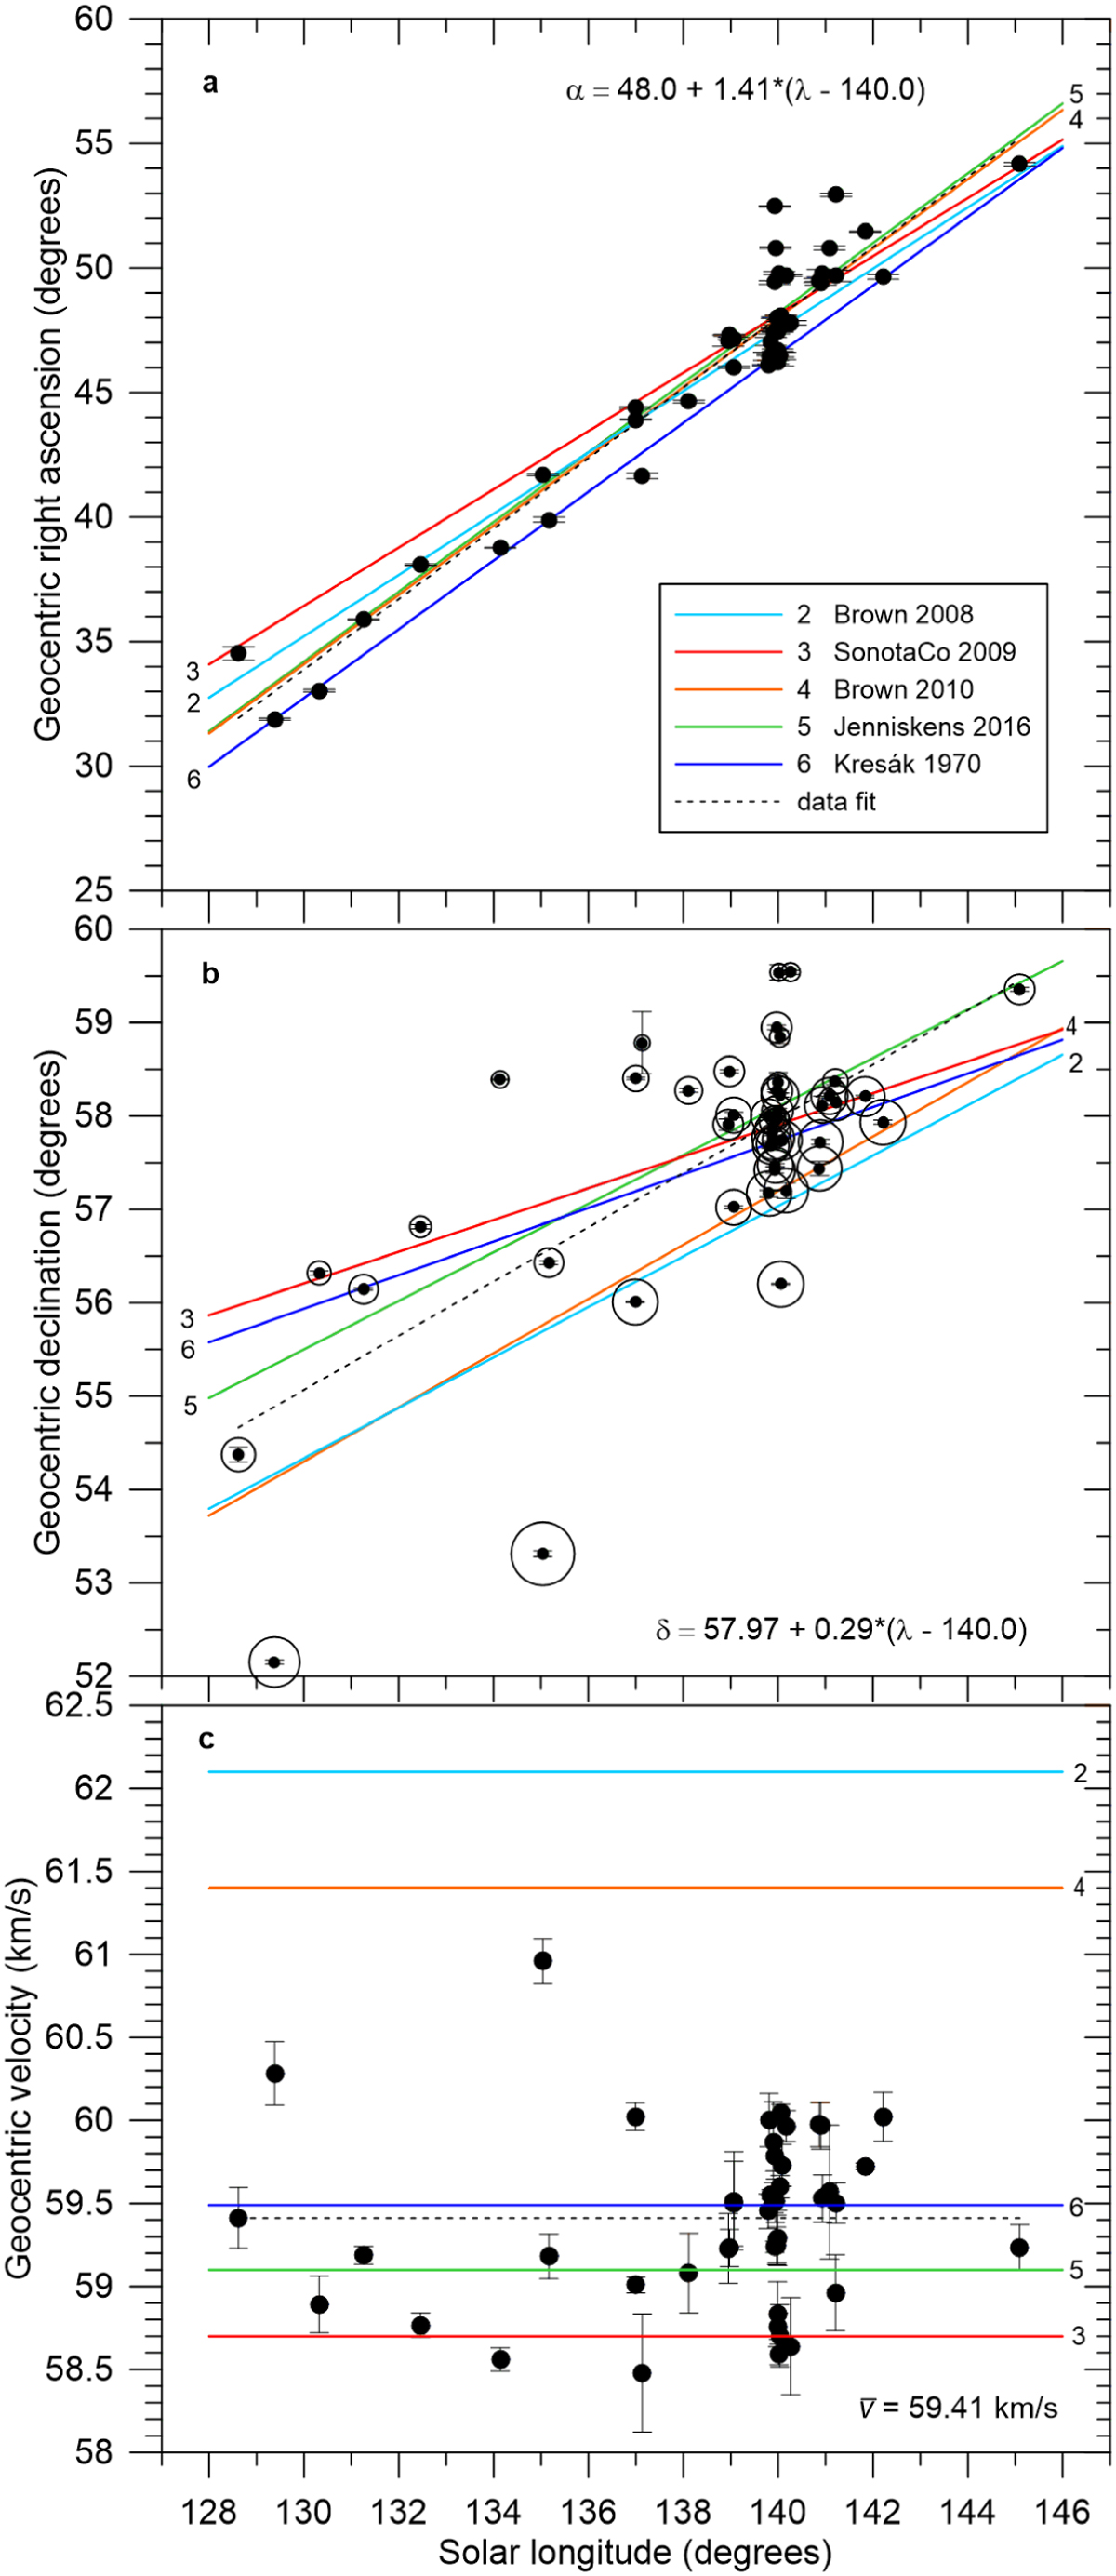
Motion of the Perseid geocentric radiant. Right ascension (panel a), declination (panel b), and velocity (panel c) are plotted as a function of solar longitude (all in FDJ2000_0) for individual meteoroids with formal error bars. The sizes of the additional circles in plot b are proportional to velocity to show the correlation between declination and velocity. The data fit is plotted as a dotted line in all plots and the corresponding equation is inserted (no change of velocity with solar longitude was assumed). The motion of the mean radiant as reported by authors cited in the IAU Meteor Data Center is plotted by solid lines as follows: 2–5 see caption of Fig. 16; 6 – Kresák & Porubcan (1970).
Current usage metrics show cumulative count of Article Views (full-text article views including HTML views, PDF and ePub downloads, according to the available data) and Abstracts Views on Vision4Press platform.
Data correspond to usage on the plateform after 2015. The current usage metrics is available 48-96 hours after online publication and is updated daily on week days.
Initial download of the metrics may take a while.