Open Access
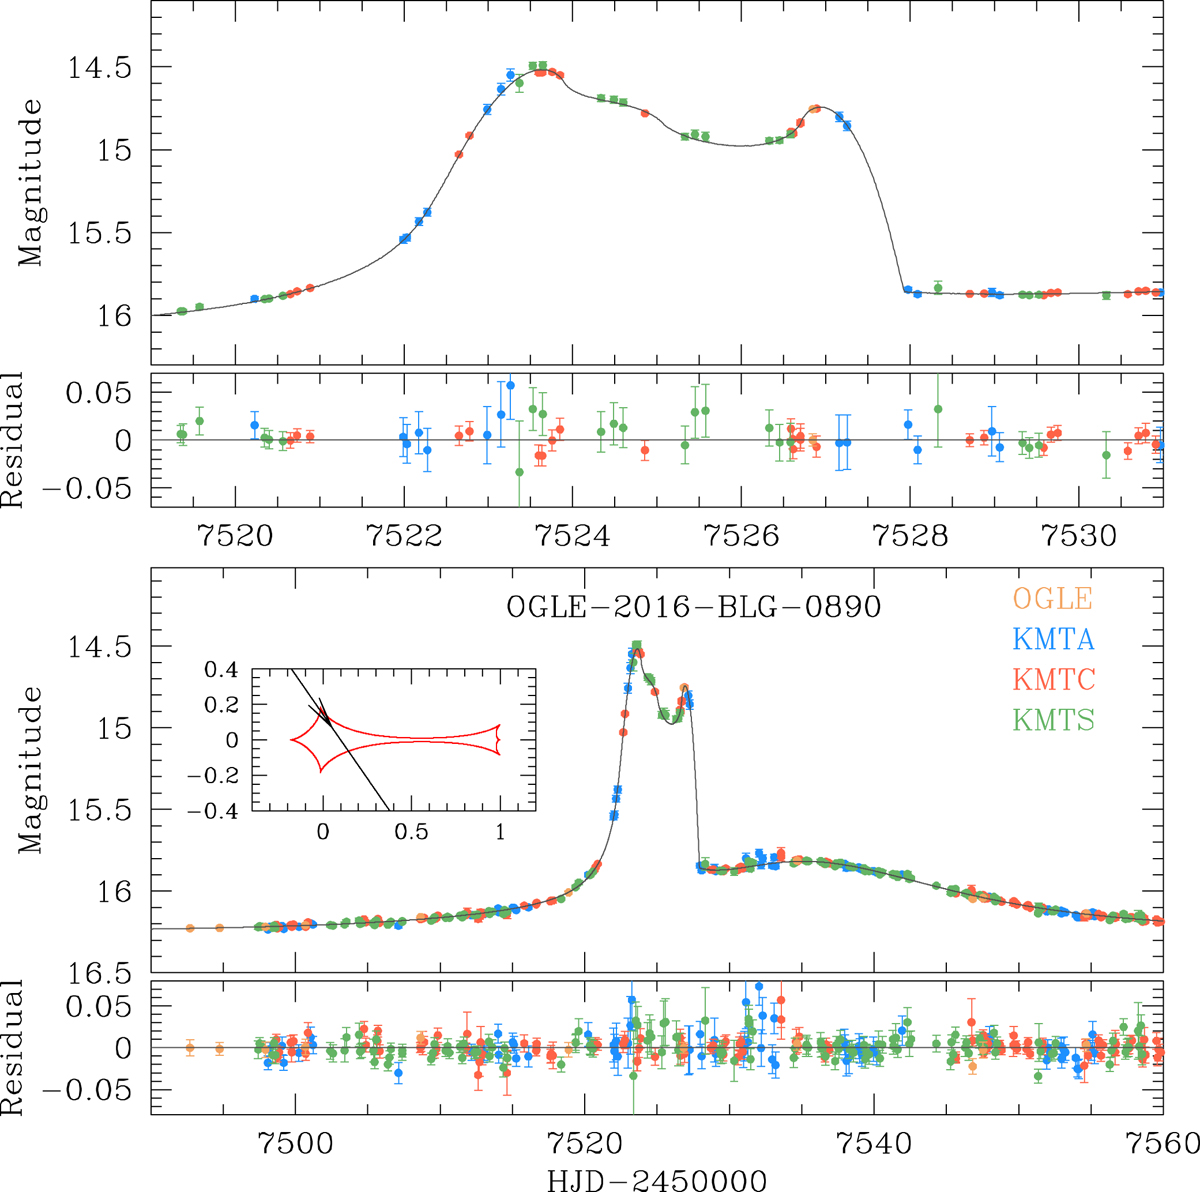
Fig. 1.
Download original image
Light curve and model of OGLE-2016-BLG-0890. Upper panel: enlargement of the major anomaly region and the residual from the model. The inset in the lower panel shows the lens-system configuration, in which the line with an arrow represents the source trajectory, and the red figure is the caustic.
Current usage metrics show cumulative count of Article Views (full-text article views including HTML views, PDF and ePub downloads, according to the available data) and Abstracts Views on Vision4Press platform.
Data correspond to usage on the plateform after 2015. The current usage metrics is available 48-96 hours after online publication and is updated daily on week days.
Initial download of the metrics may take a while.