Fig. 10.
Download original image
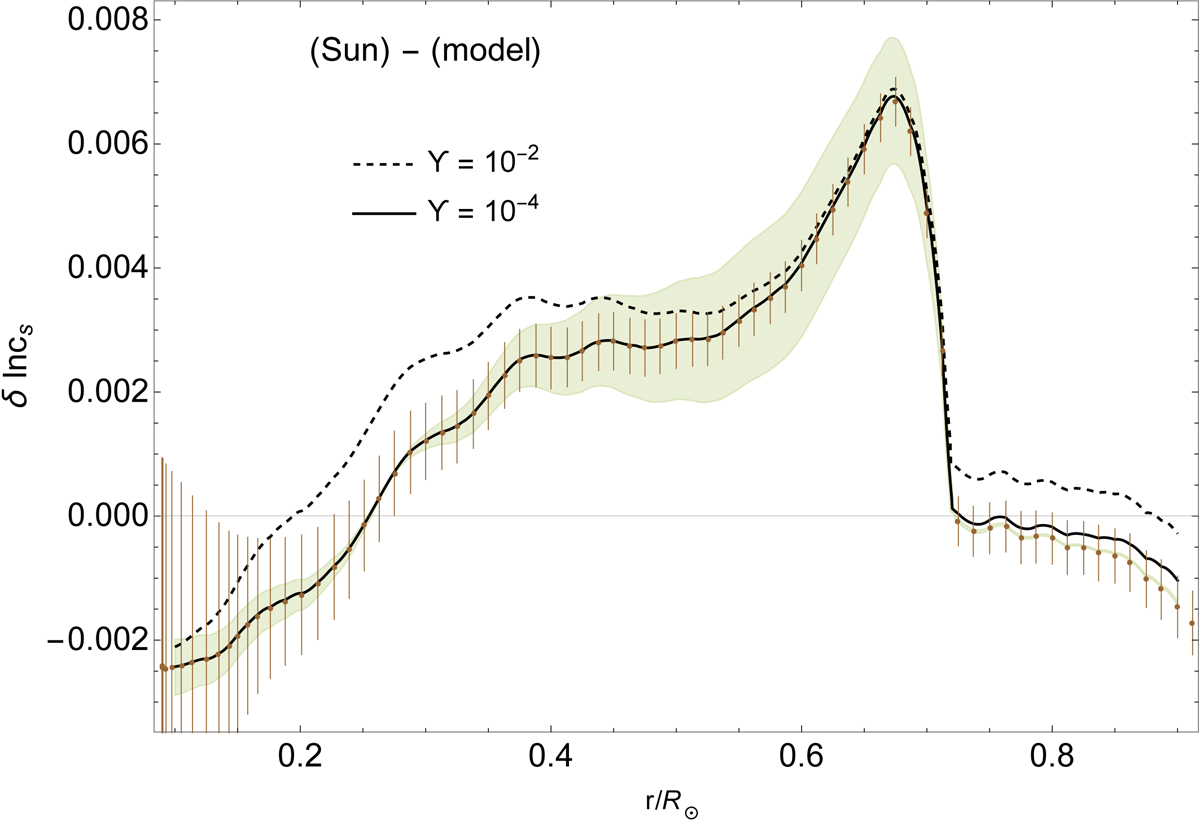
Difference between the predicted (model) sound-speed profile and the profile derived from the inversion of helioseismic data (Sun), in the sense (Sun) – (model). The brown vertical bars show the errors on the inverted helioseismic data points, according to the results of Rhodes (1997). Errors have been multiplied by a factor of 10. The shaded band corresponds to the maximum uncertainty from our modelling of opacity and diffusion, while the continuous and dashed curves to a modified model computed with a fifth-force coupling of 𝒴 = 10−2 and 10−4 respectively. Fifth-force models are computed on top of our reference GS98 model at standard gravity (see Table 2). The fifth-force effect in the radiative zone is clearly seen for 𝒴 = 10−2, as expected from the model differences of Figs. 5 and 6.
Current usage metrics show cumulative count of Article Views (full-text article views including HTML views, PDF and ePub downloads, according to the available data) and Abstracts Views on Vision4Press platform.
Data correspond to usage on the plateform after 2015. The current usage metrics is available 48-96 hours after online publication and is updated daily on week days.
Initial download of the metrics may take a while.