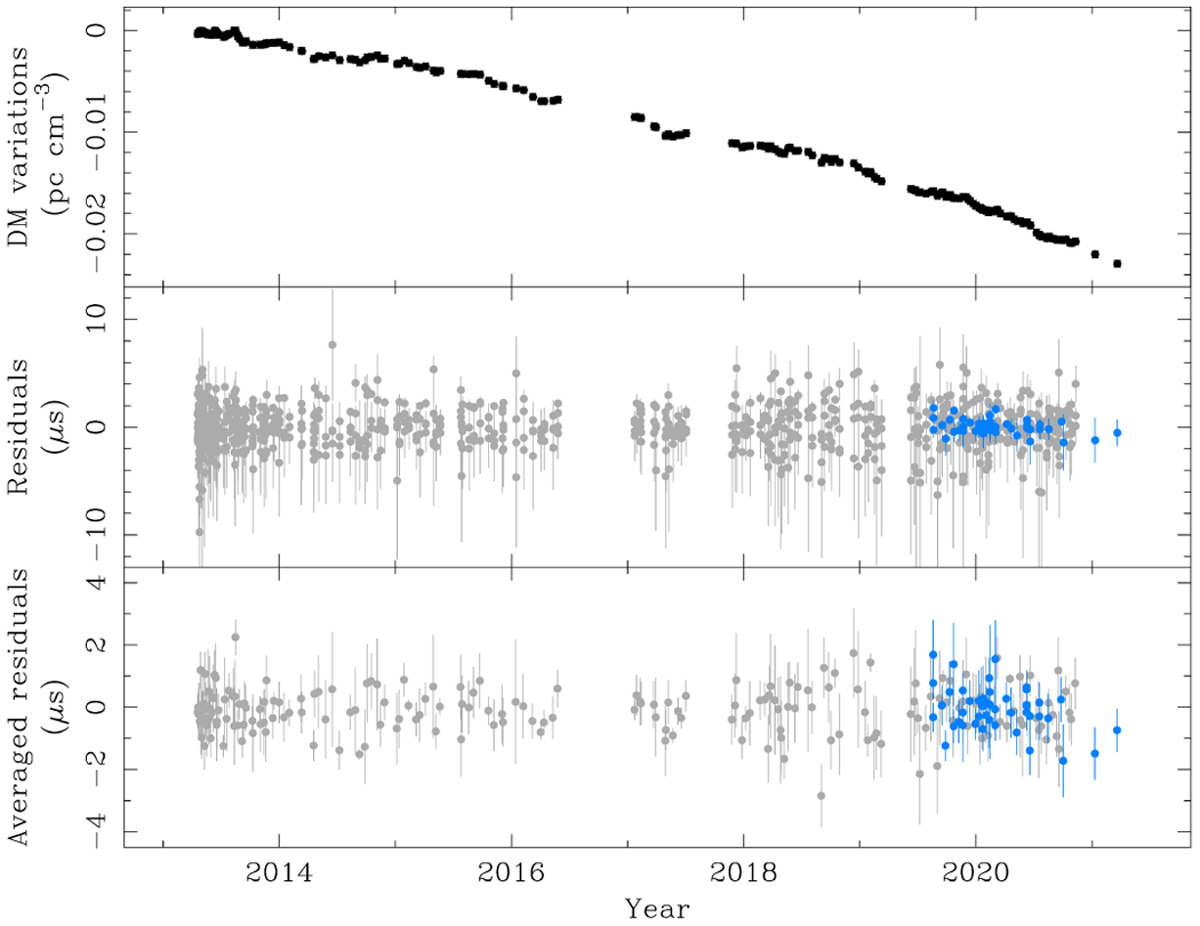
Fig. 8
Download original image
Timing results of PSR J2205+6012. Top panel: waveform of the DM variations from the maximum likelihood results of the TempoNest analysis. Middle panel: timing residuals after subtraction of the ML DM variations waveform. Bottom panel: same as middle panel but with the averaged timing residuals from the NRT subbanded data. Grey points and blue triangles represent the NRT L-band and Effelsberg S-band data, respectively.
Current usage metrics show cumulative count of Article Views (full-text article views including HTML views, PDF and ePub downloads, according to the available data) and Abstracts Views on Vision4Press platform.
Data correspond to usage on the plateform after 2015. The current usage metrics is available 48-96 hours after online publication and is updated daily on week days.
Initial download of the metrics may take a while.