Fig. 4
Download original image
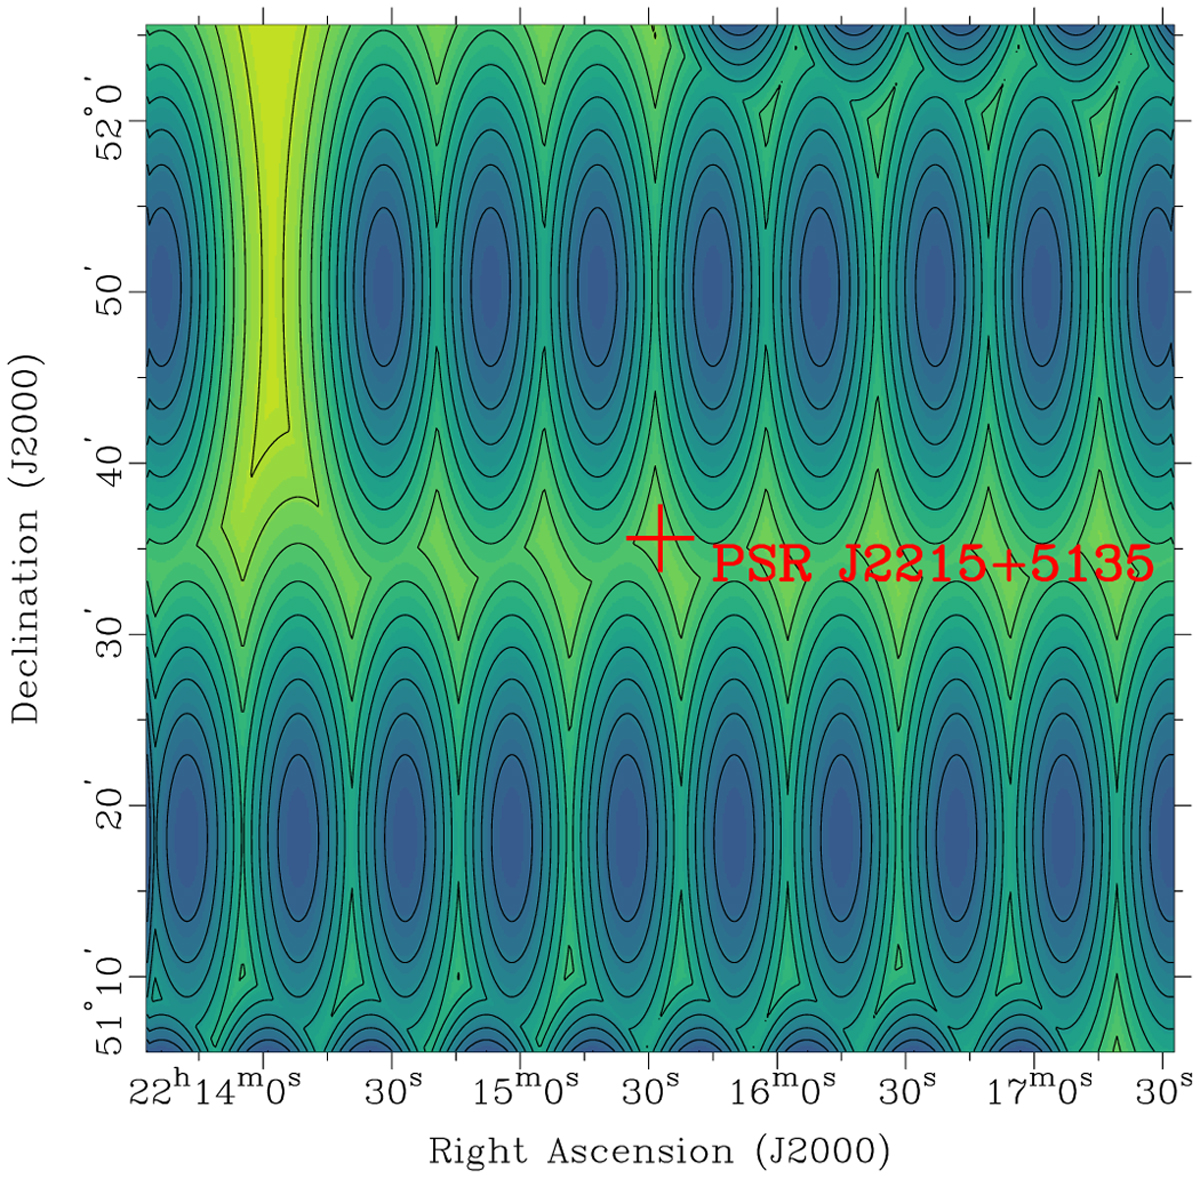
Positions of the SPAN512 pointings near the location of the previously known pulsar J2215+5135 (depicted with a red cross). The black contours mark the antenna gain by steps of 0.1 K Jy−1. The colour scale is the same as in Fig. 2. This map shows PSR J2215+5135 falling between beams with a reduced gain on target of 0.23 K Jy−1, explaining its non-detection by the survey. The strip of reduced sensitivity in the top left part of the plot is due to one of approximately 700 non-observed grid pointings.
Current usage metrics show cumulative count of Article Views (full-text article views including HTML views, PDF and ePub downloads, according to the available data) and Abstracts Views on Vision4Press platform.
Data correspond to usage on the plateform after 2015. The current usage metrics is available 48-96 hours after online publication and is updated daily on week days.
Initial download of the metrics may take a while.