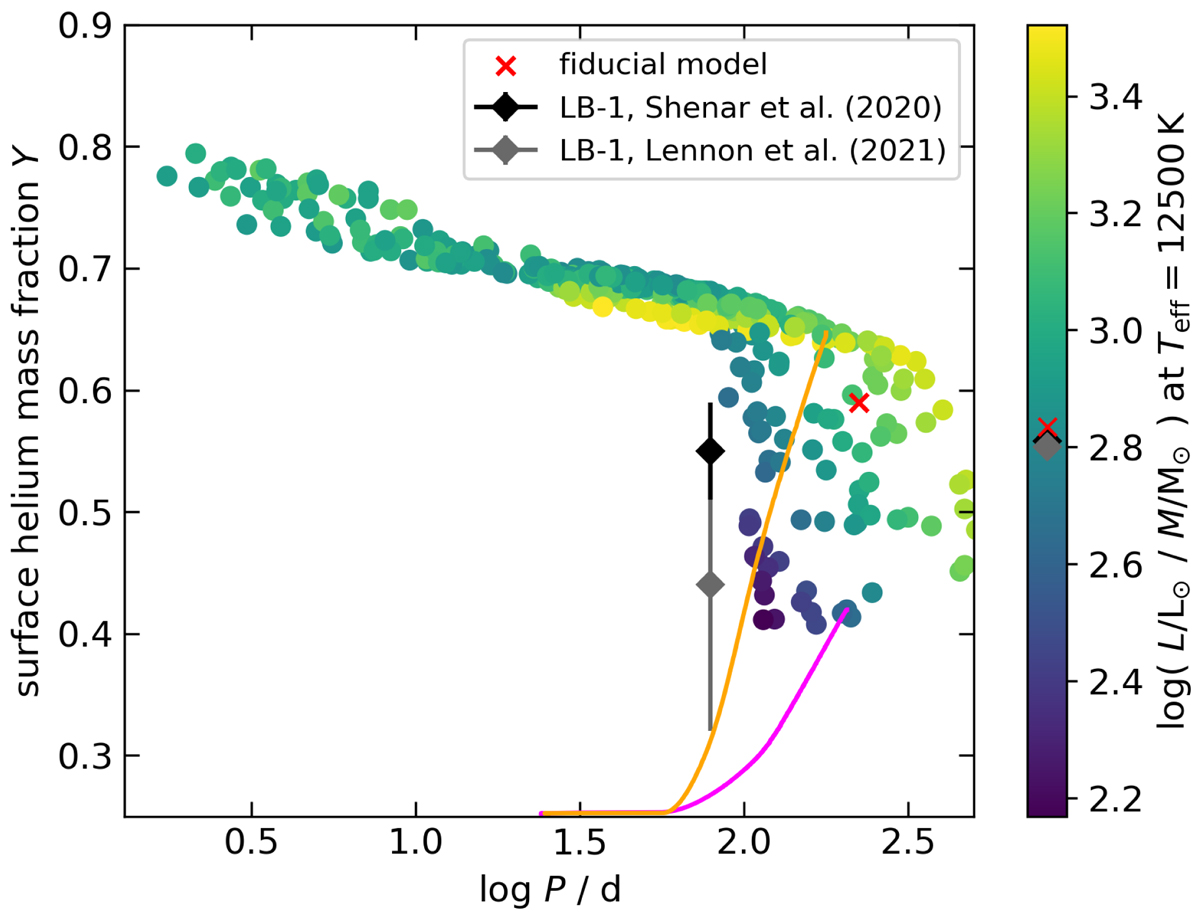
Fig. 9.
Download original image
Period, surface helium abundance, and luminosity-to-mass ratio during the contraction phase after RLO, when the stripped star has obtained an effective temperature of 12 500 K (close to that derived for LB-1). The black and grey symbols indicate the values for LB-1, as derived by Shenar et al. (2020) and Lennon et al. (2021, almost superimposed in the colour bar). The fiducial model is shown in red. The orange curve (initially 4.27 M⊙ + 4.07 M⊙ at Porb = 24.2 d) shows the surface helium evolution of a mass donor, which does not develop convection in its outer layers during RLO. In the magenta curve (initially 5.86 M⊙ + 4.20 M⊙ at Porb = 25.4 d) convection sets in.
Current usage metrics show cumulative count of Article Views (full-text article views including HTML views, PDF and ePub downloads, according to the available data) and Abstracts Views on Vision4Press platform.
Data correspond to usage on the plateform after 2015. The current usage metrics is available 48-96 hours after online publication and is updated daily on week days.
Initial download of the metrics may take a while.