Fig. 5.
Download original image
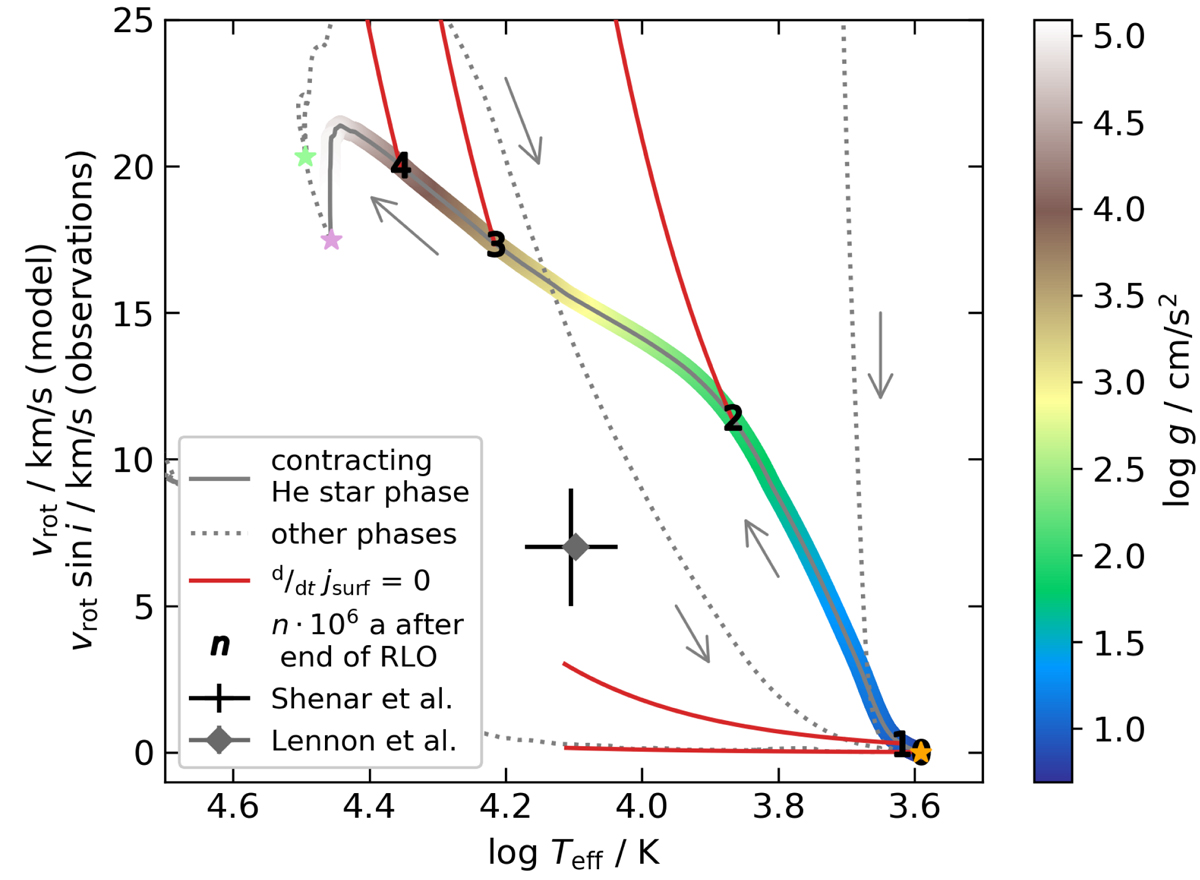
Surface rotational velocity and surface gravity (colour-coded) as a function of the effective temperature of the stripped component of our fiducial binary model. The coloured part of the curve indicates the contraction phase from RLO decoupling towards the sdOB phase. The dashed black lines show the evolution before and after that phase, with arrows indicating the direction of evolution. The time elapsed after the RLO is indicated in Ma by the numbers on the curve. The two observational data points (black and grey) are from Shenar et al. (2020) and Lennon et al. (2021, the errors are smaller than symbol size). The measured rotational velocity includes a factor of sini. The red lines indicate the rotational evolution if the specific angular momentum of the stellar surface was conserved. The star symbols indicate the evolutionary stages, as in Fig. 1.
Current usage metrics show cumulative count of Article Views (full-text article views including HTML views, PDF and ePub downloads, according to the available data) and Abstracts Views on Vision4Press platform.
Data correspond to usage on the plateform after 2015. The current usage metrics is available 48-96 hours after online publication and is updated daily on week days.
Initial download of the metrics may take a while.