Fig. 2.
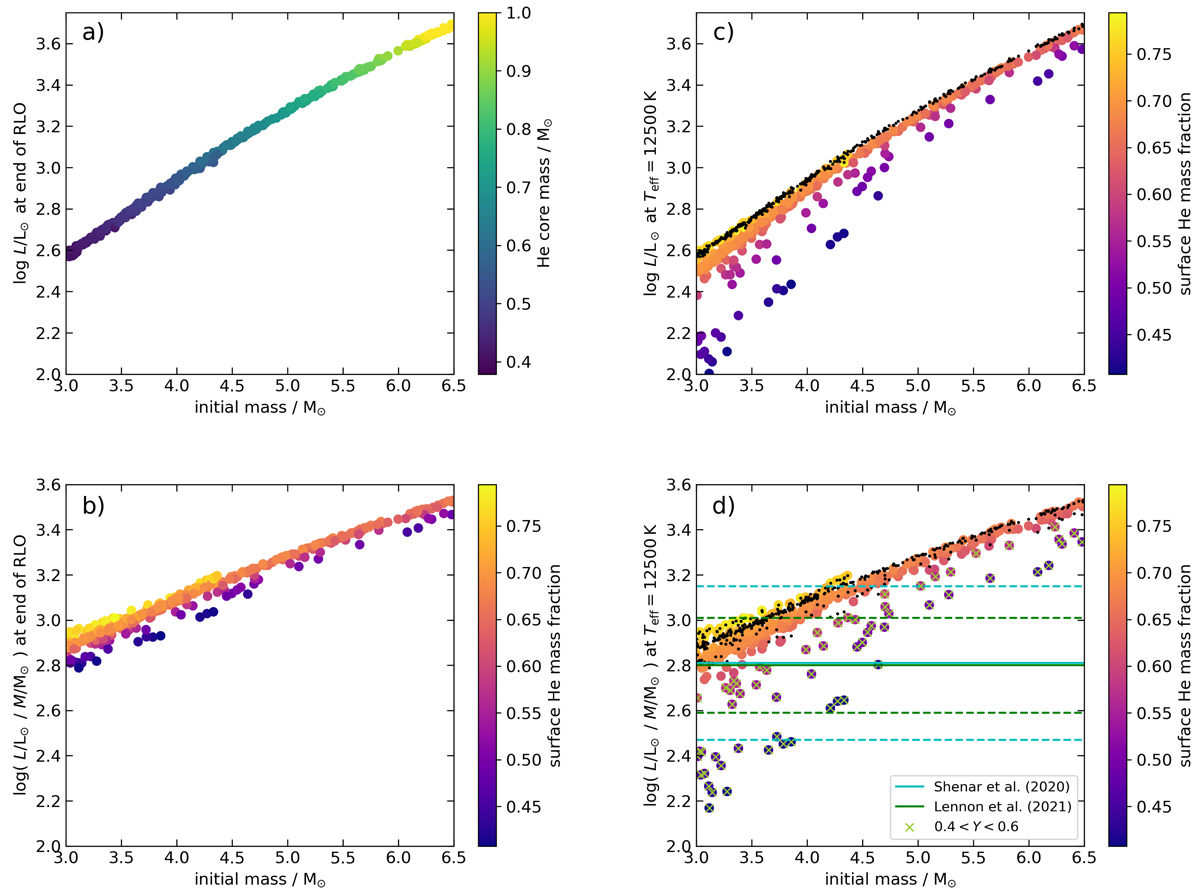
Download original image
Relation between the initial mass of our models and their luminosity or luminosity-to-mass ratio at selected evolutionary phases. (a) Luminosity and helium core mass of the mass donor immediately after the end of RLO as a function of the initial mass. All shown models underwent a Case B mass transfer. (b) Luminosity-to-mass ratio and surface helium mass fraction immediately after end of RLO as well as the initial masses of the models above. (c) Luminosity and surface helium mass fraction when the donor star surface temperature is 12 500 K during the contraction after RLO Case B as a function of initial mass. The black dots represent the state immediately after RLO (panel a). A few models have such a massive envelope that they never reach 12 500 K, and are not included. (d) Luminosity-to-mass ratio and surface helium mass fraction when the surface temperature is 12 500 K depending in the initial mass. The black dots represent the state at RLO end (panel b). The blue and green lines (almost superimposed) indicate the L/M from Shenar et al. (2020) and Lennon et al. (2021) with errors shown as dashed lines. Models with a surface helium abundance within the adopted range ([0.4, 0.6]) are indicated by green crosses.
Current usage metrics show cumulative count of Article Views (full-text article views including HTML views, PDF and ePub downloads, according to the available data) and Abstracts Views on Vision4Press platform.
Data correspond to usage on the plateform after 2015. The current usage metrics is available 48-96 hours after online publication and is updated daily on week days.
Initial download of the metrics may take a while.