Open Access
Fig. B.1.
Download original image
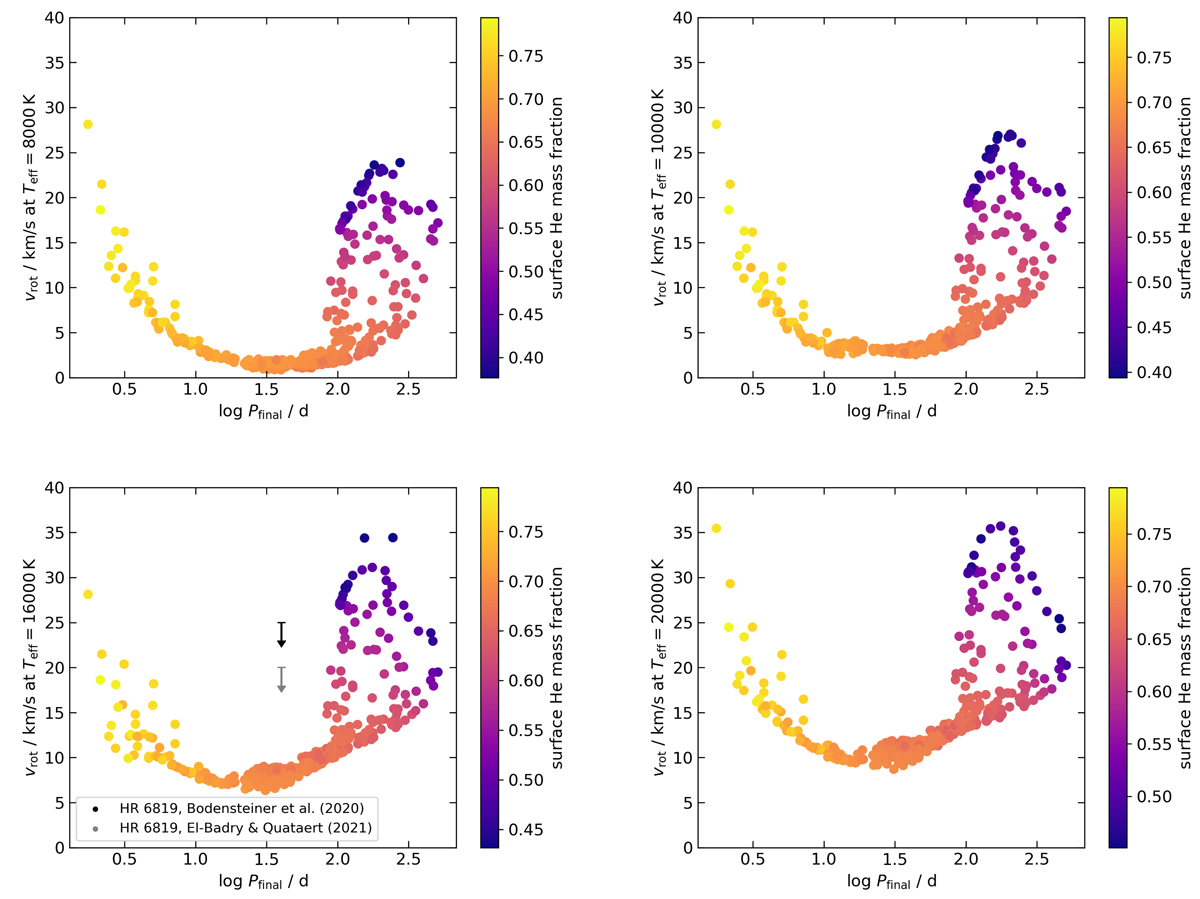
Same as Fig. 7, but with an effective temperature of 8 000 K (top left), 10 000 K (top right), 16 000 K (bottom left), and 20 000 K (bottom right). The bottom left panel shows the measurements of Bodensteiner et al. (2020b) and El-Badry & Quataert (2021) for HR 6819.
Current usage metrics show cumulative count of Article Views (full-text article views including HTML views, PDF and ePub downloads, according to the available data) and Abstracts Views on Vision4Press platform.
Data correspond to usage on the plateform after 2015. The current usage metrics is available 48-96 hours after online publication and is updated daily on week days.
Initial download of the metrics may take a while.