Open Access
Fig. 1.
Download original image
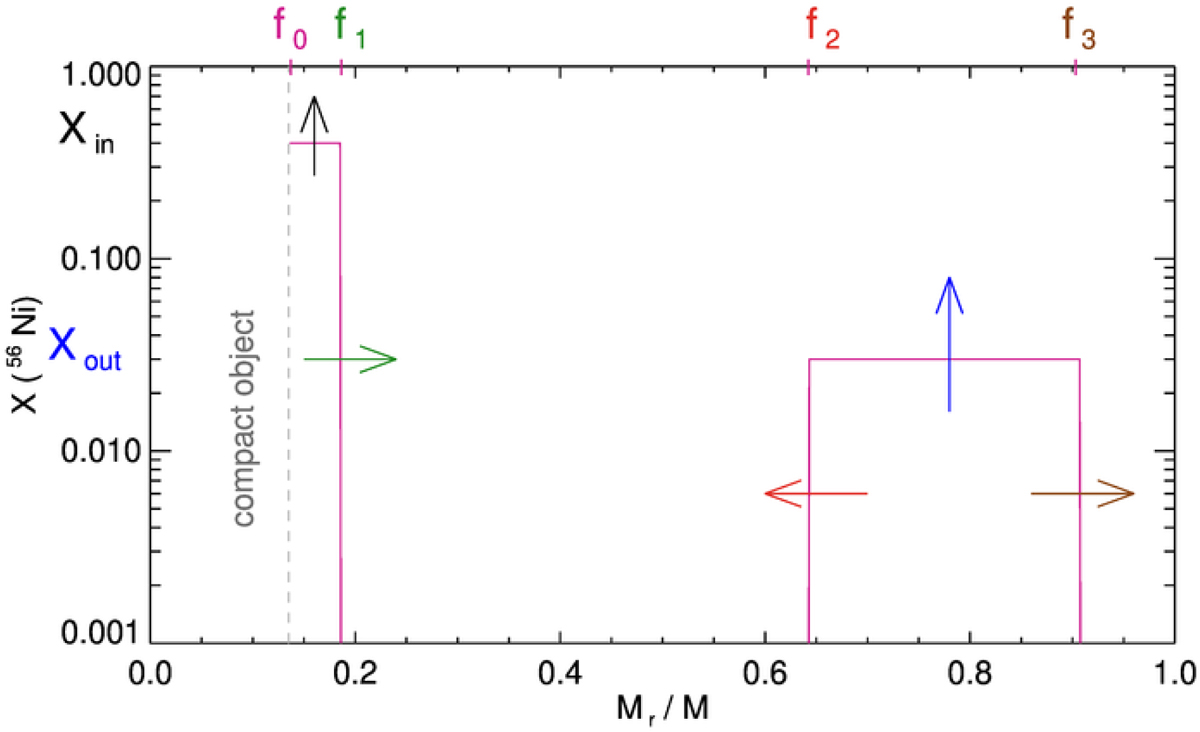
Schematic abundance profile of 56Ni as a function of the interior mass fraction in the star. The parameters used to describe this distribution are indicated in the axes. The color of each arrow and corresponding label is used in next figures to facilitate the interpretation.
Current usage metrics show cumulative count of Article Views (full-text article views including HTML views, PDF and ePub downloads, according to the available data) and Abstracts Views on Vision4Press platform.
Data correspond to usage on the plateform after 2015. The current usage metrics is available 48-96 hours after online publication and is updated daily on week days.
Initial download of the metrics may take a while.