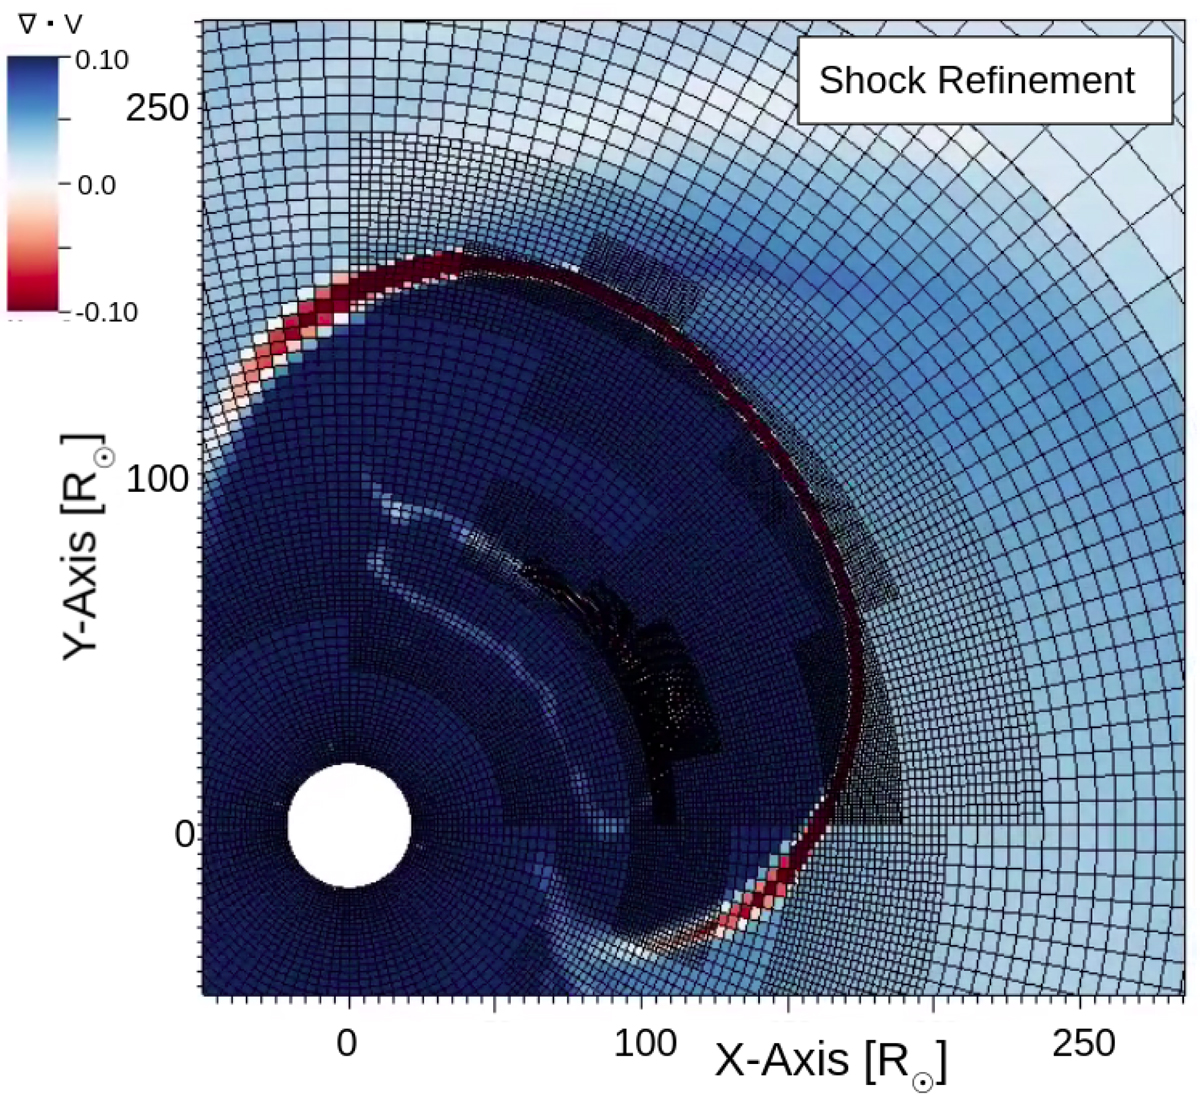
Fig. 5.
Download original image
(∇⋅V) criterion from the AMR level 4 simulation run (yielding approximately the same radial resolution at L1 as the EUHFORIA run that is shown in Fig. 7 for comparison) focusing on the CME shock front. The maximum positive and negative values in the domain are normalised to +0.05 and −0.05, respectively. Blue and red denote areas of expansion and compression, respectively.
Current usage metrics show cumulative count of Article Views (full-text article views including HTML views, PDF and ePub downloads, according to the available data) and Abstracts Views on Vision4Press platform.
Data correspond to usage on the plateform after 2015. The current usage metrics is available 48-96 hours after online publication and is updated daily on week days.
Initial download of the metrics may take a while.