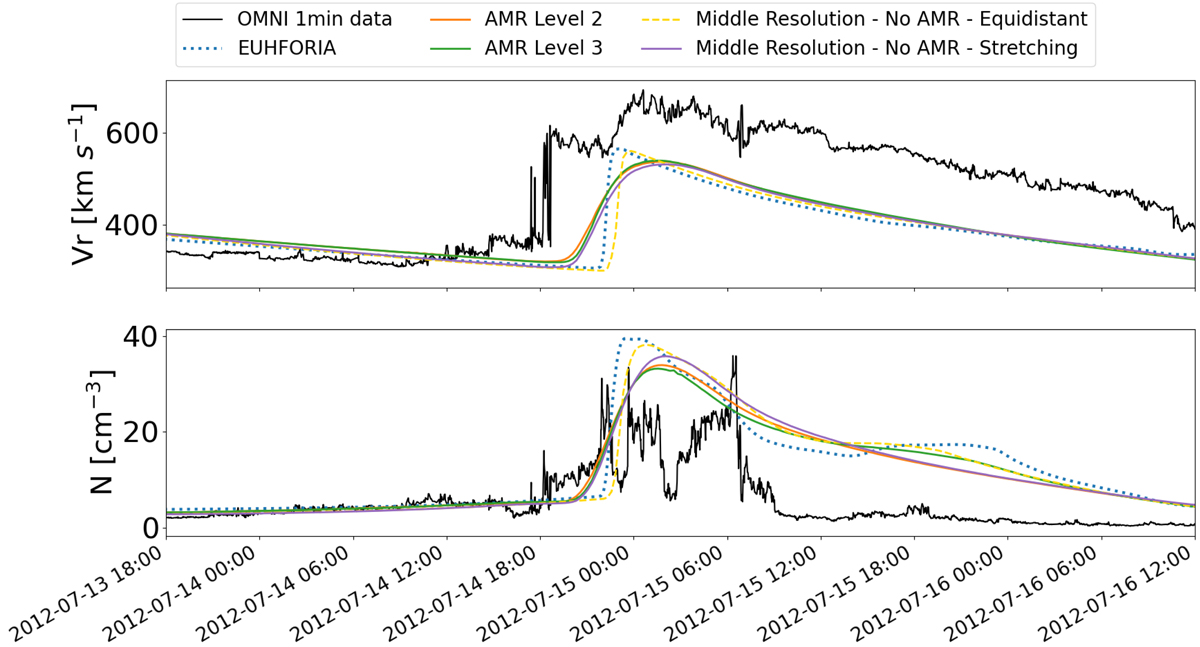
Fig. 3.
Download original image
Time series at the Earth for the radial velocity values given in km s−1 and number density given in cm−3. The tracing function is used for the AMR criteria. The black curve shows the observed values, the blue curve shows the original EUHFORIA result for the high-resolution simulation, and the orange, green, yellow, and purple curves correspond, respectively, to the AMR level 2 simulation, the AMR level 3 simulation, the middle-resolution simulation without AMR performed on an equidistant grid without stretching, and the middle-resolution run without AMR with grid stretching applied to the computational domain. The horizontal axis shows the time evolution.
Current usage metrics show cumulative count of Article Views (full-text article views including HTML views, PDF and ePub downloads, according to the available data) and Abstracts Views on Vision4Press platform.
Data correspond to usage on the plateform after 2015. The current usage metrics is available 48-96 hours after online publication and is updated daily on week days.
Initial download of the metrics may take a while.