Fig. 6.
Download original image
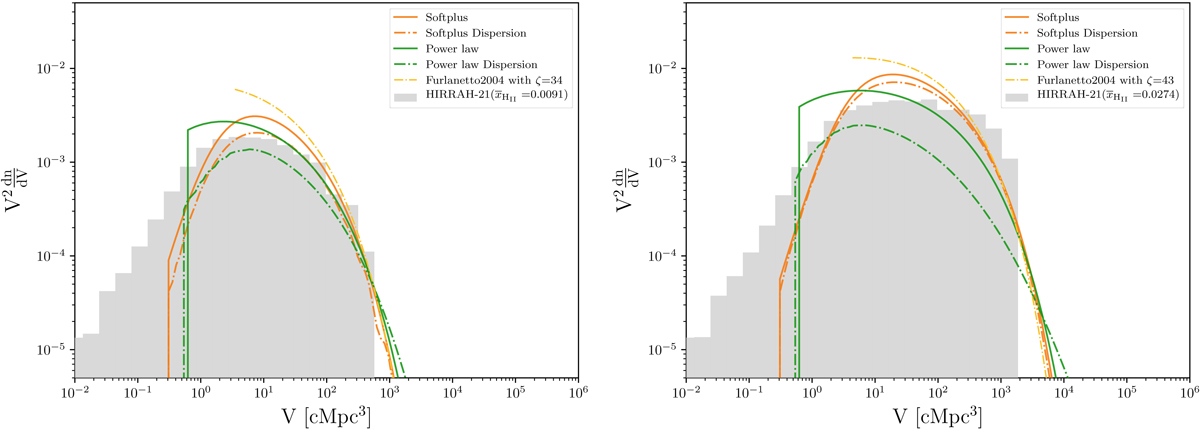
Various fit of the reference numerical BSD (gray histogram) using power law parameterization from Sect. 3.1.1 (green lines) or logarithmic Softplus parameterization from Sect. 3.1.2 (orange lines) considering the dispersion (dashed lines) and not (solid lines). A numerical fit of the reference BSD using Eq. (1) from Furlanetto et al. (2004) inferring the efficiency parameter ζ is shown as a comparison (yellow dashed line). The fit is done at xH II ∼ 1% (left panel) and xH II ∼ 3% (right panel).
Current usage metrics show cumulative count of Article Views (full-text article views including HTML views, PDF and ePub downloads, according to the available data) and Abstracts Views on Vision4Press platform.
Data correspond to usage on the plateform after 2015. The current usage metrics is available 48-96 hours after online publication and is updated daily on week days.
Initial download of the metrics may take a while.