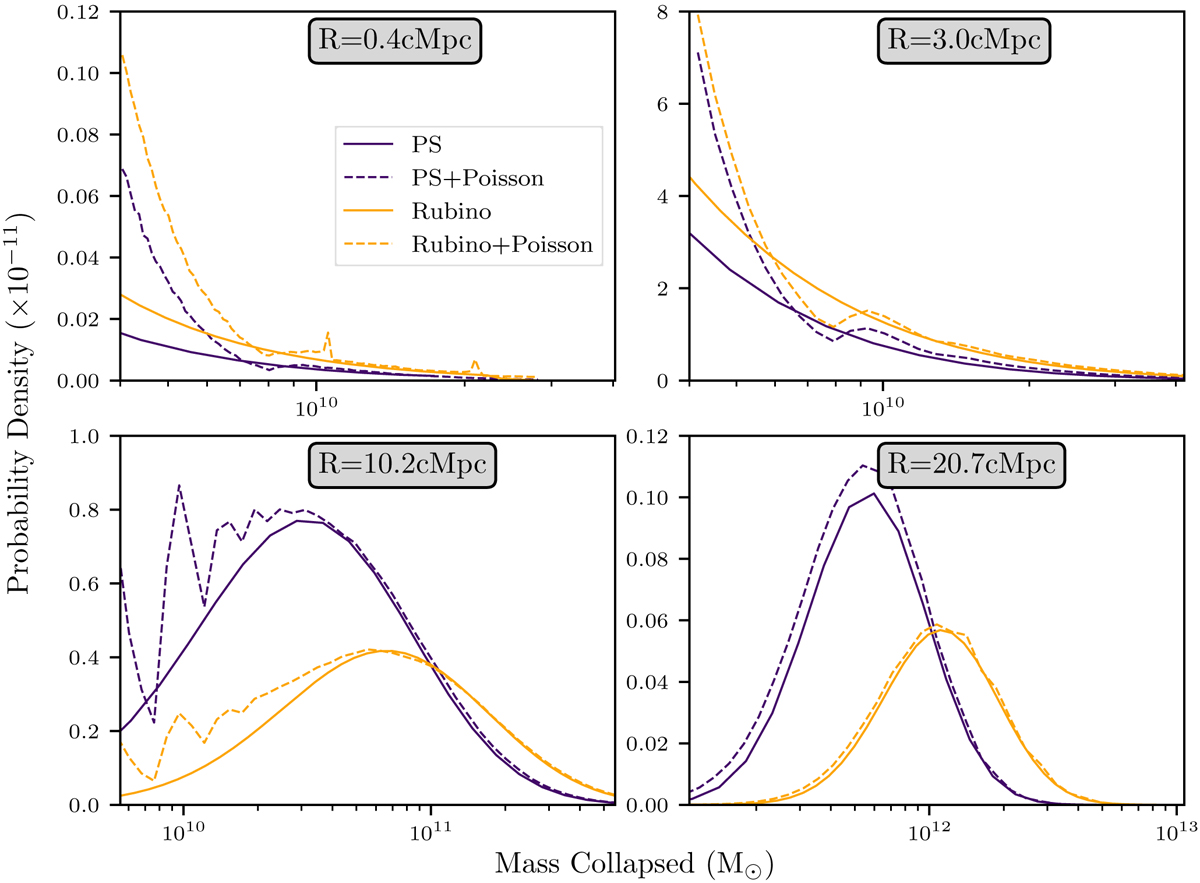
Fig. 3.
Download original image
Collapsed mass distribution computed at redshift z ∼ 9.8 (corresponding to xH II ∼ 1%) considering the sample variance (dashed lines) or not (solid lines) using the conditional mass function of Eq. (3) (purple) or of Eq. (2) (yellow). The results are shown for ionized regions of radius of: 0.4 cMpc, 3 cMpc, 10 cMpc, and 20 cMpc.
Current usage metrics show cumulative count of Article Views (full-text article views including HTML views, PDF and ePub downloads, according to the available data) and Abstracts Views on Vision4Press platform.
Data correspond to usage on the plateform after 2015. The current usage metrics is available 48-96 hours after online publication and is updated daily on week days.
Initial download of the metrics may take a while.