Fig. 10.
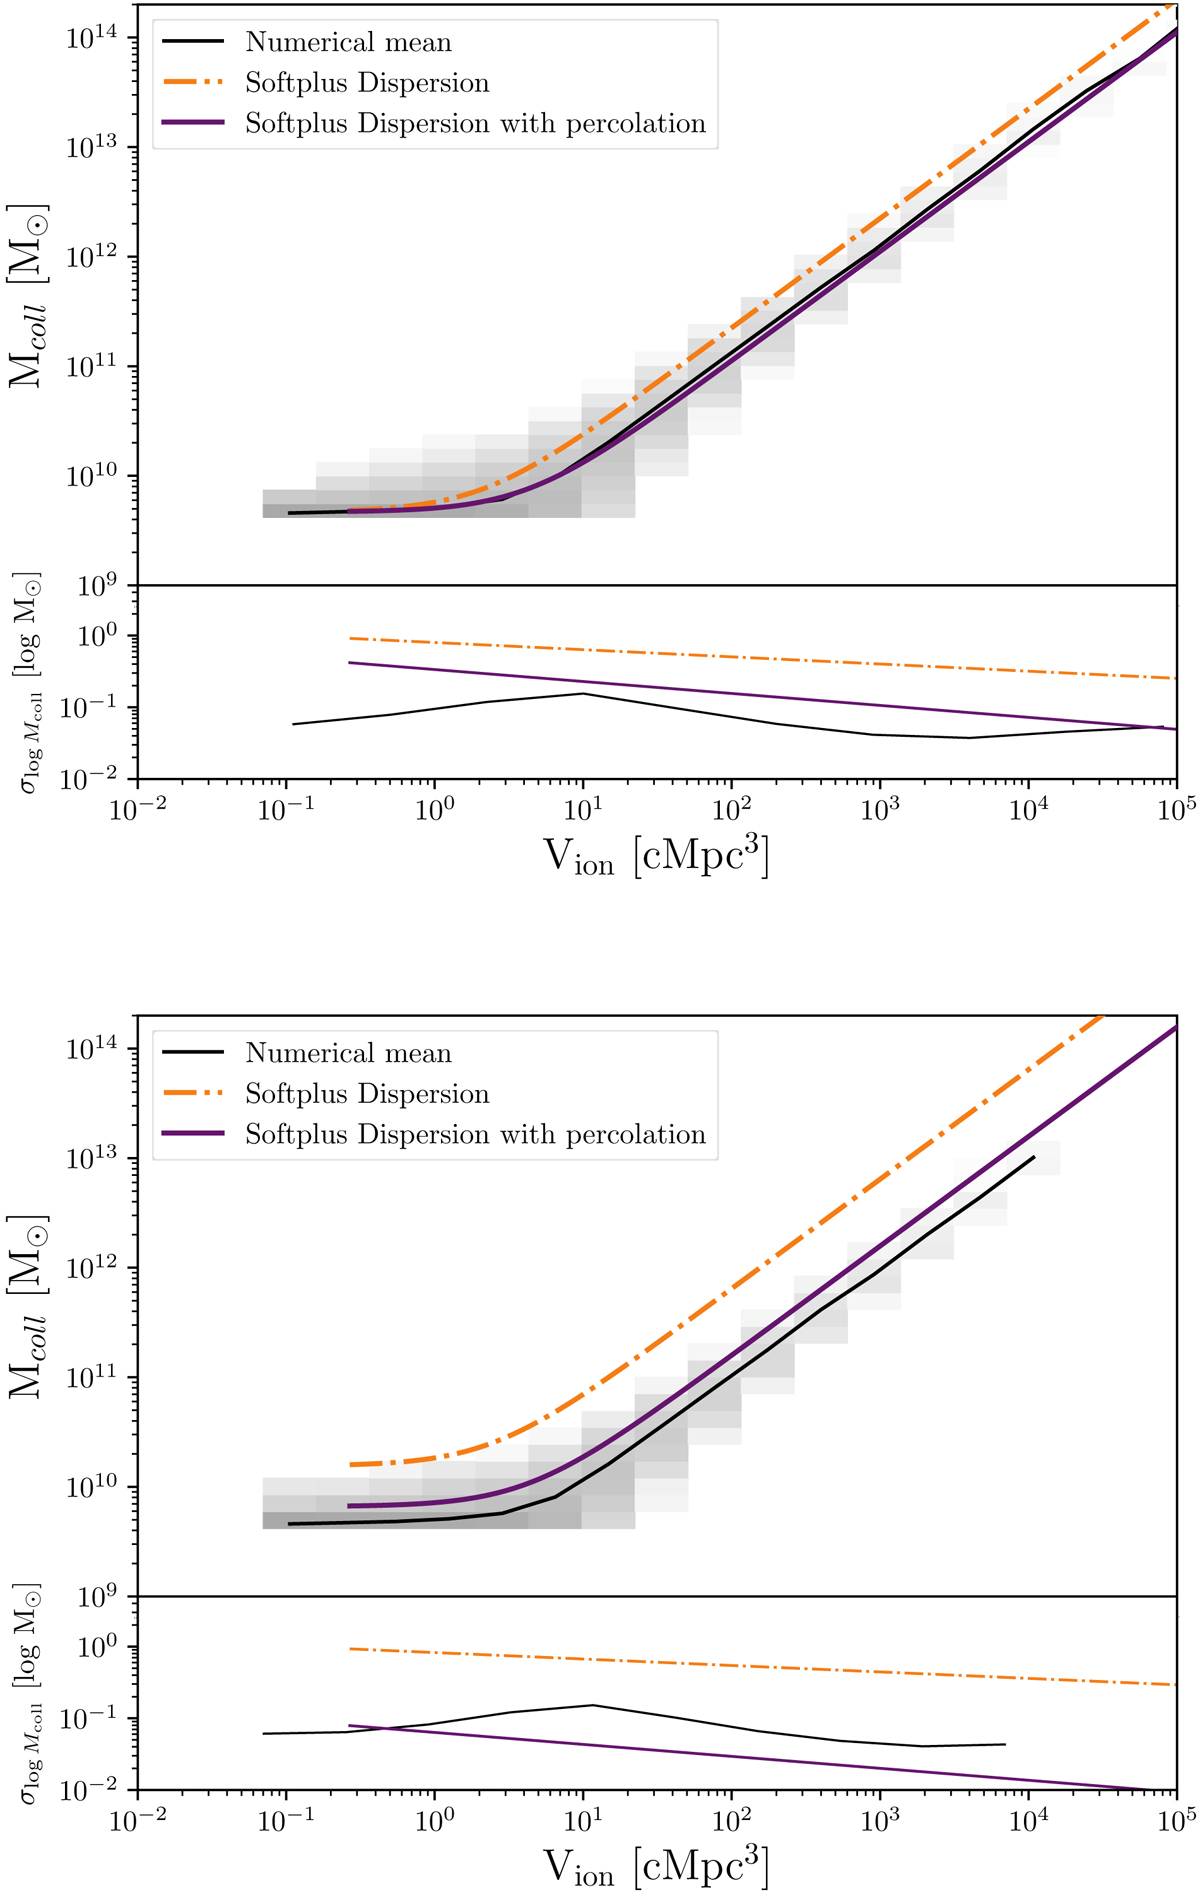
Download original image
Collapsed mass inside an ionized region as a function of its volume. The gray colormap represents the distribution of halos the HIRRAH-21 simulation and its numerical mean and dispersion are shown as black lines in the corresponding panels. The inferred relations using the logarithmic Softplus parameterization from Sect. 3.1.2 considering the dispersion with percolation (purple line) and without percolation (orange line) are shown. The fit is done at xH II ∼ 10% (top) and xH II ∼ 22% (bottom).
Current usage metrics show cumulative count of Article Views (full-text article views including HTML views, PDF and ePub downloads, according to the available data) and Abstracts Views on Vision4Press platform.
Data correspond to usage on the plateform after 2015. The current usage metrics is available 48-96 hours after online publication and is updated daily on week days.
Initial download of the metrics may take a while.