Fig. 7.
Download original image
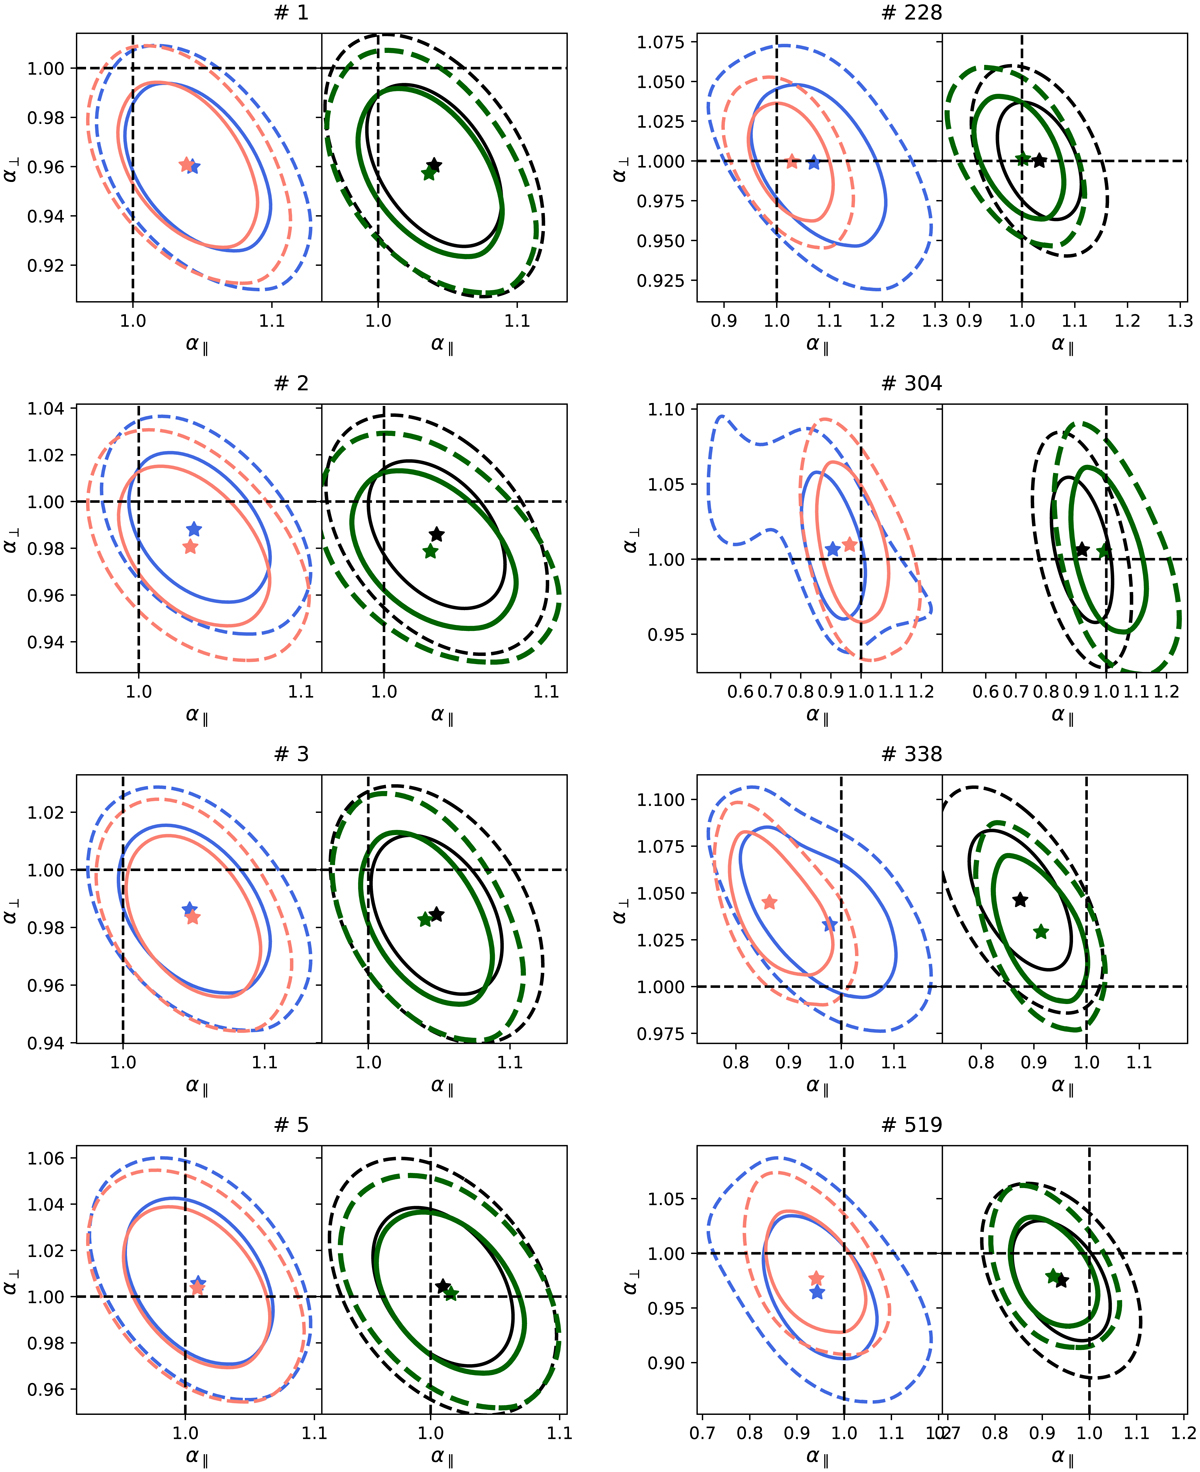
Comparison between the different methods, using some EZmock realisations (mock tag above each plot), when the contours found in configuration or Fourier space are Gaussian (left) and non Gaussian (right). Red contours are for FS results, blue for CS, green for JS and black for GA. The expected value is the intersection of the dotted black lines, and the best fit values are described by a star for the JS and GA methods. We can see how the JS method yields better combined results that are not necessarily Gaussian.
Current usage metrics show cumulative count of Article Views (full-text article views including HTML views, PDF and ePub downloads, according to the available data) and Abstracts Views on Vision4Press platform.
Data correspond to usage on the plateform after 2015. The current usage metrics is available 48-96 hours after online publication and is updated daily on week days.
Initial download of the metrics may take a while.