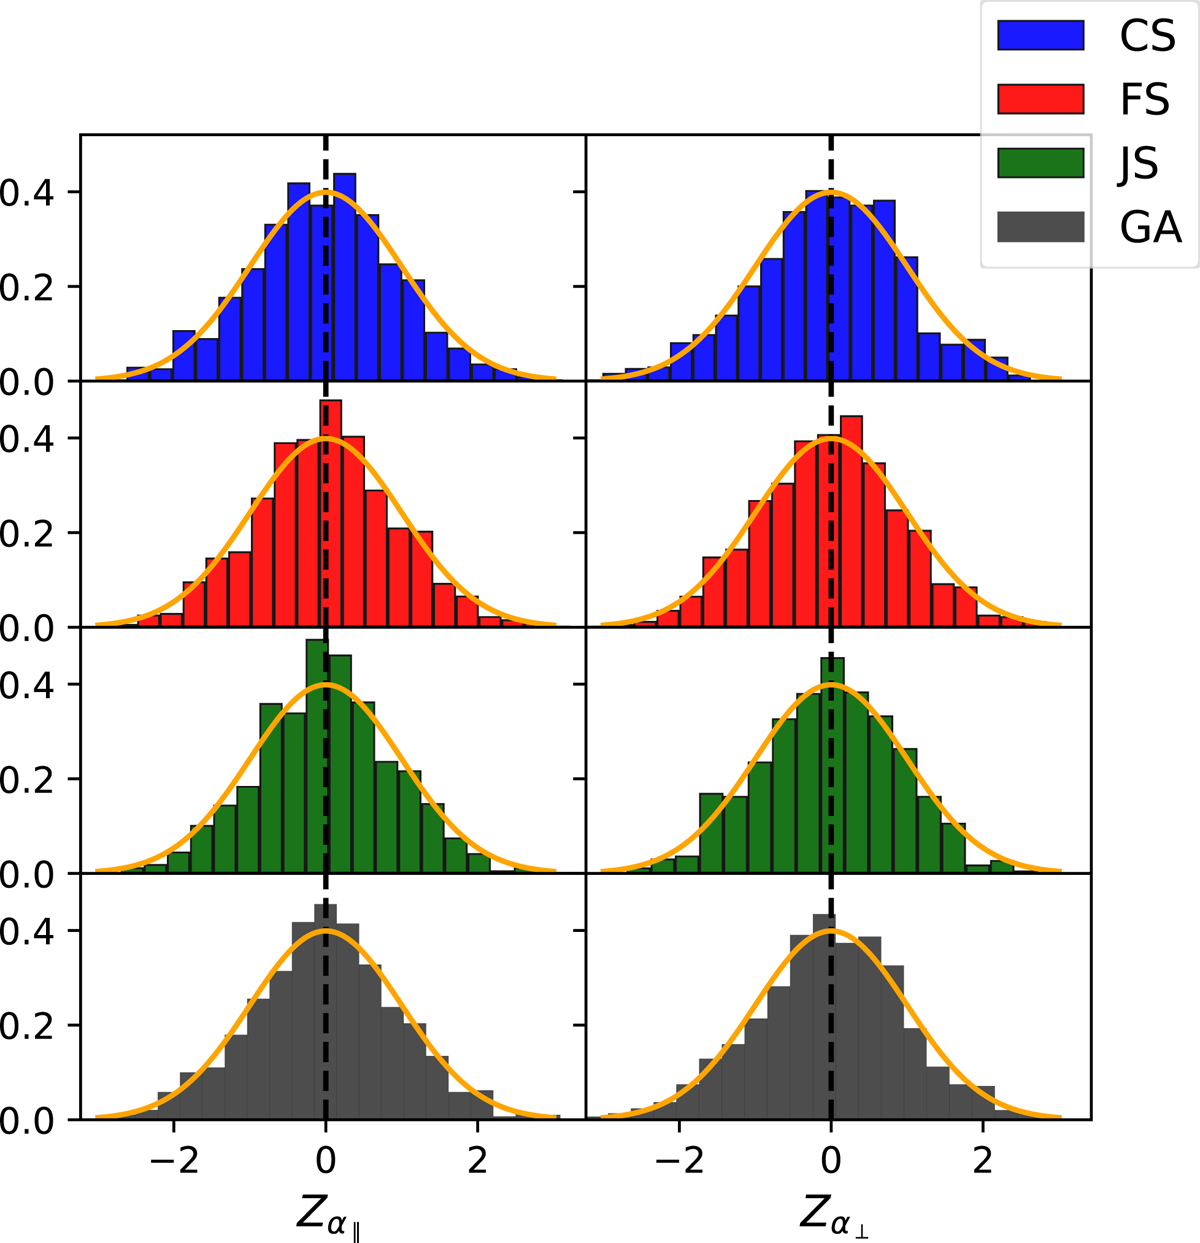
Fig. 6.
Download original image
Distributions of the pull Zi = (xi−⟨xi⟩)/σi for the parameters (α∥,α⊥) obtained obtained from the CS, FS, GA and JS analyses of the 1000 EZmocks sample. Orange curves describing a Gaussian distribution with zero mean and the standard deviation of the corresponding pull are shown for comparison. The dotted lines are centered on zero.
Current usage metrics show cumulative count of Article Views (full-text article views including HTML views, PDF and ePub downloads, according to the available data) and Abstracts Views on Vision4Press platform.
Data correspond to usage on the plateform after 2015. The current usage metrics is available 48-96 hours after online publication and is updated daily on week days.
Initial download of the metrics may take a while.