Fig. 2.
Download original image
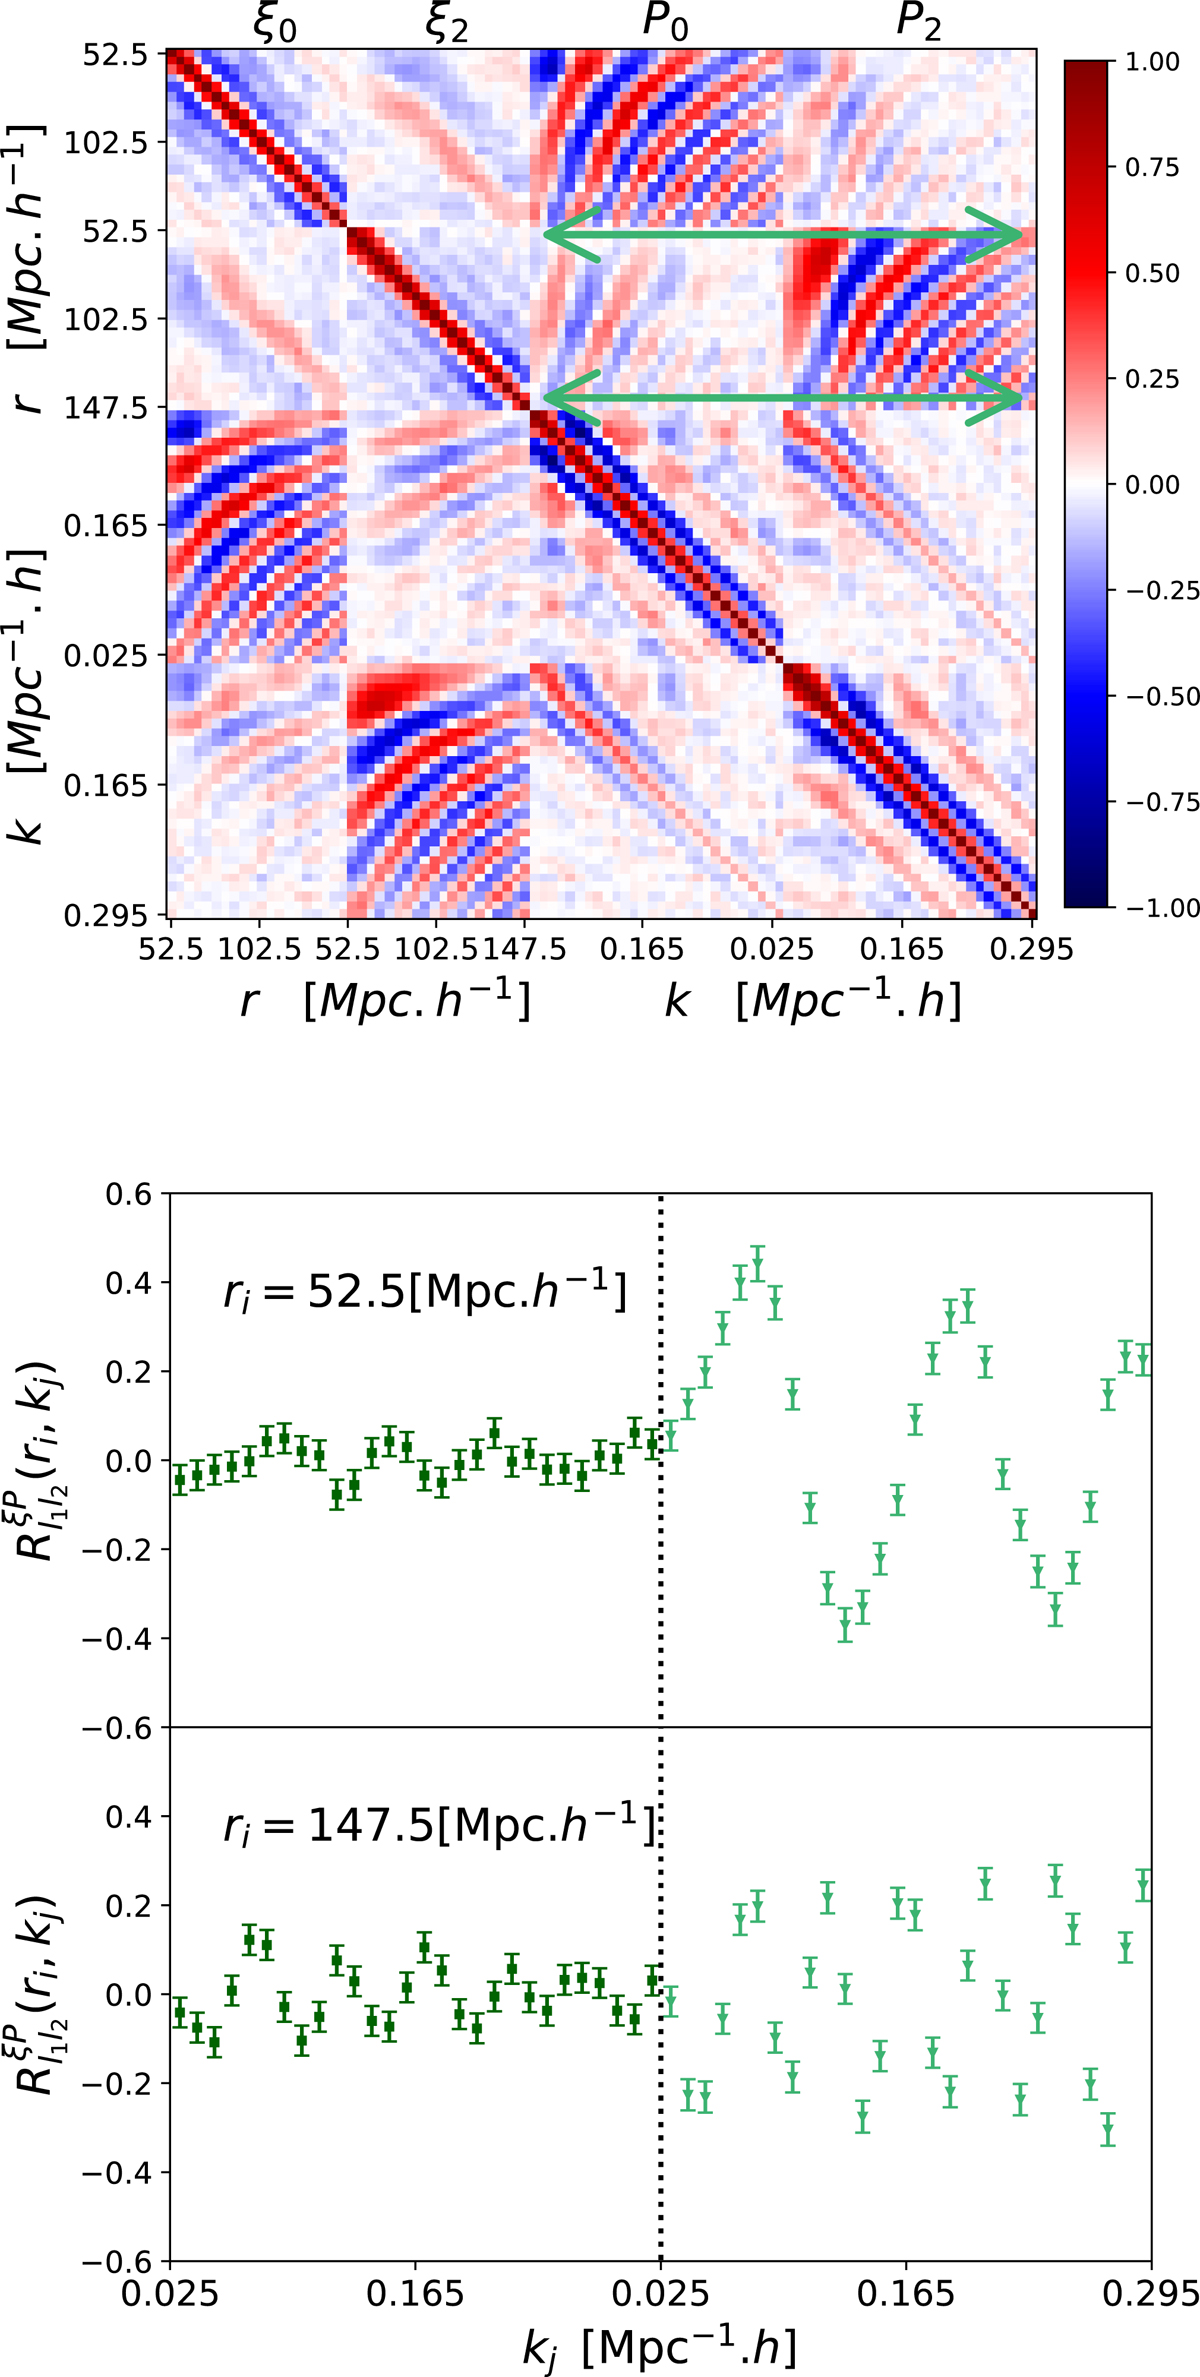
Precision matrix of the correlation function ξℓ and power spectrum multipoles Pℓ. Top panel: normalized estimated precision matrix ![]() , obtained from 1000 EZmock realisations. Bottom panel: slices of
, obtained from 1000 EZmock realisations. Bottom panel: slices of ![]() showing the cross-correlation between ξℓ and Pℓ for particular values of scales as shown by the green arrows in the left panel. Errors are estimated from Eq. (29) of Taylor et al. (2013).
showing the cross-correlation between ξℓ and Pℓ for particular values of scales as shown by the green arrows in the left panel. Errors are estimated from Eq. (29) of Taylor et al. (2013).
Current usage metrics show cumulative count of Article Views (full-text article views including HTML views, PDF and ePub downloads, according to the available data) and Abstracts Views on Vision4Press platform.
Data correspond to usage on the plateform after 2015. The current usage metrics is available 48-96 hours after online publication and is updated daily on week days.
Initial download of the metrics may take a while.