Open Access
Fig. C.1.
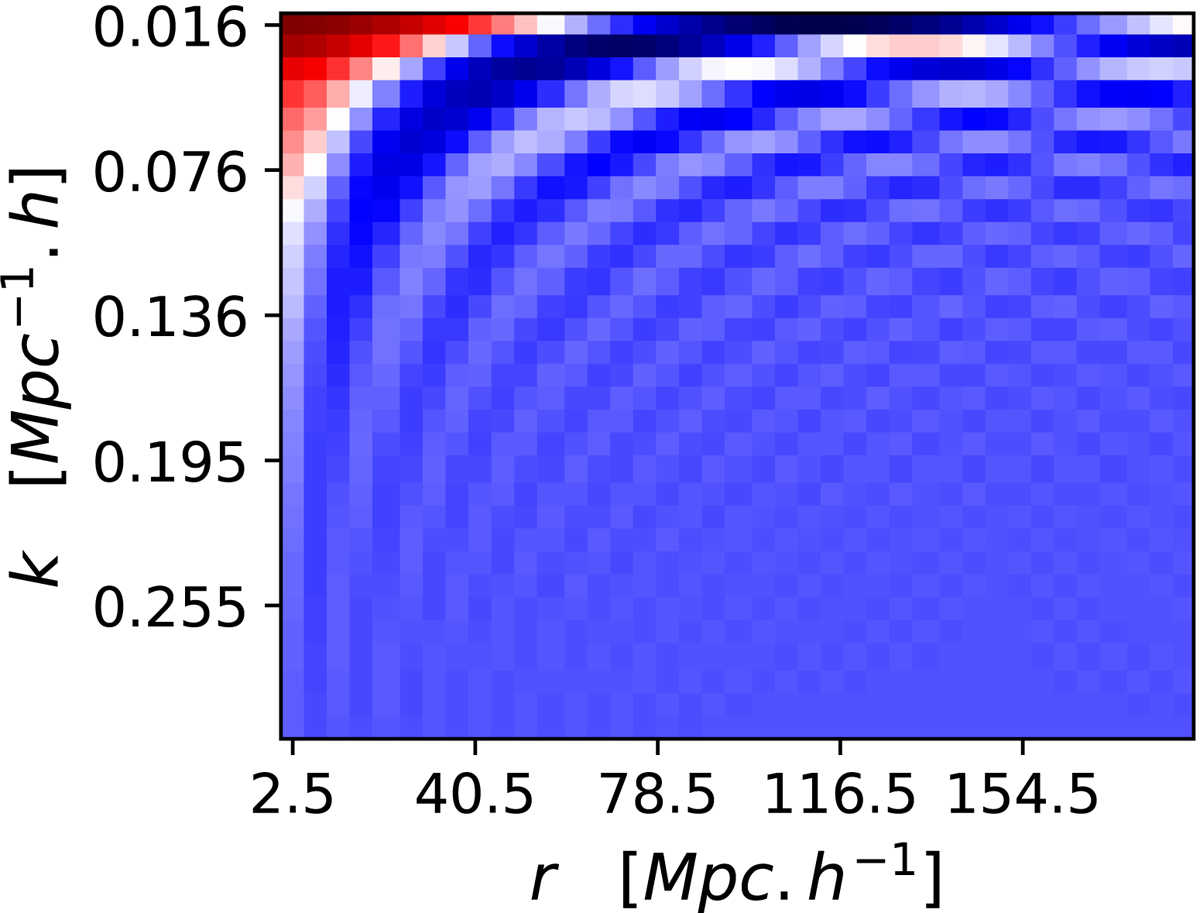
Download original image
Analytical modeling of the cross correlations between the correlation function and the power spectrum monopoles for a given range of scales. We do not display the colorbar as we set the shot noise to zero and the volume of the survey to one.
Current usage metrics show cumulative count of Article Views (full-text article views including HTML views, PDF and ePub downloads, according to the available data) and Abstracts Views on Vision4Press platform.
Data correspond to usage on the plateform after 2015. The current usage metrics is available 48-96 hours after online publication and is updated daily on week days.
Initial download of the metrics may take a while.