Fig. 9
Download original image
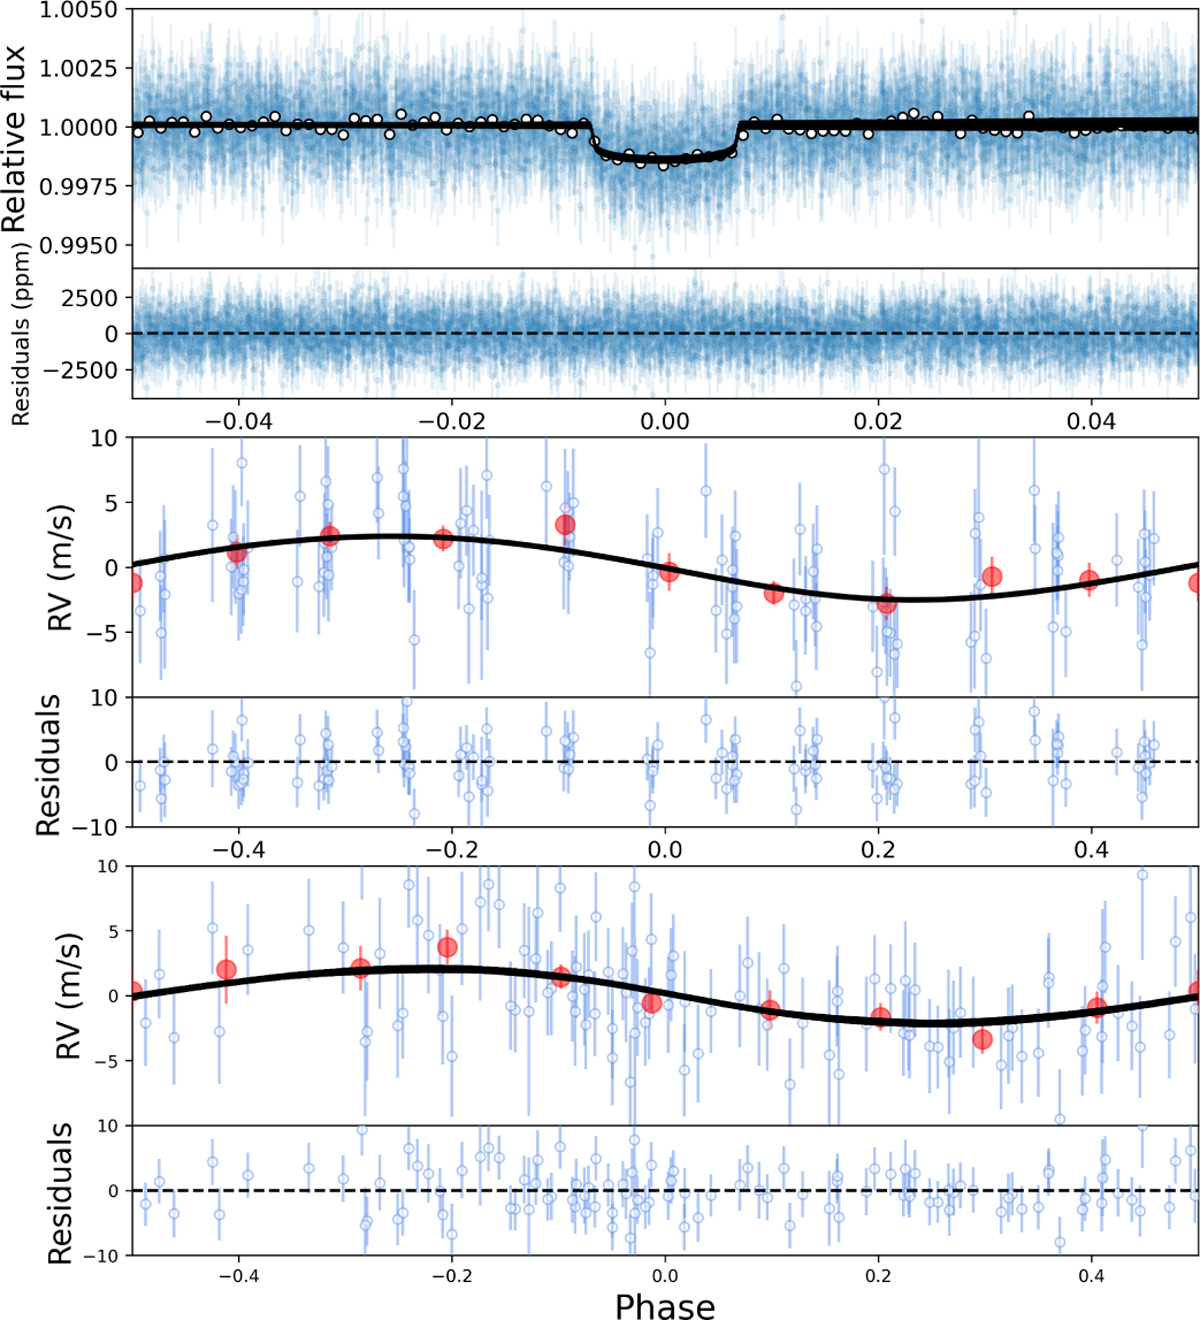
TESS light curve and RV curves phase-folded. Top panel: TOI-1422 b transit, compared to the best-fitting model. Bottom panels: HARPS-N RV data phase-folded to the period of planet b (middle) and candidate c (bottom), along with their residuals over the model. The red circles represent the average value of phased RV data points.
Current usage metrics show cumulative count of Article Views (full-text article views including HTML views, PDF and ePub downloads, according to the available data) and Abstracts Views on Vision4Press platform.
Data correspond to usage on the plateform after 2015. The current usage metrics is available 48-96 hours after online publication and is updated daily on week days.
Initial download of the metrics may take a while.