Fig. 5
Download original image
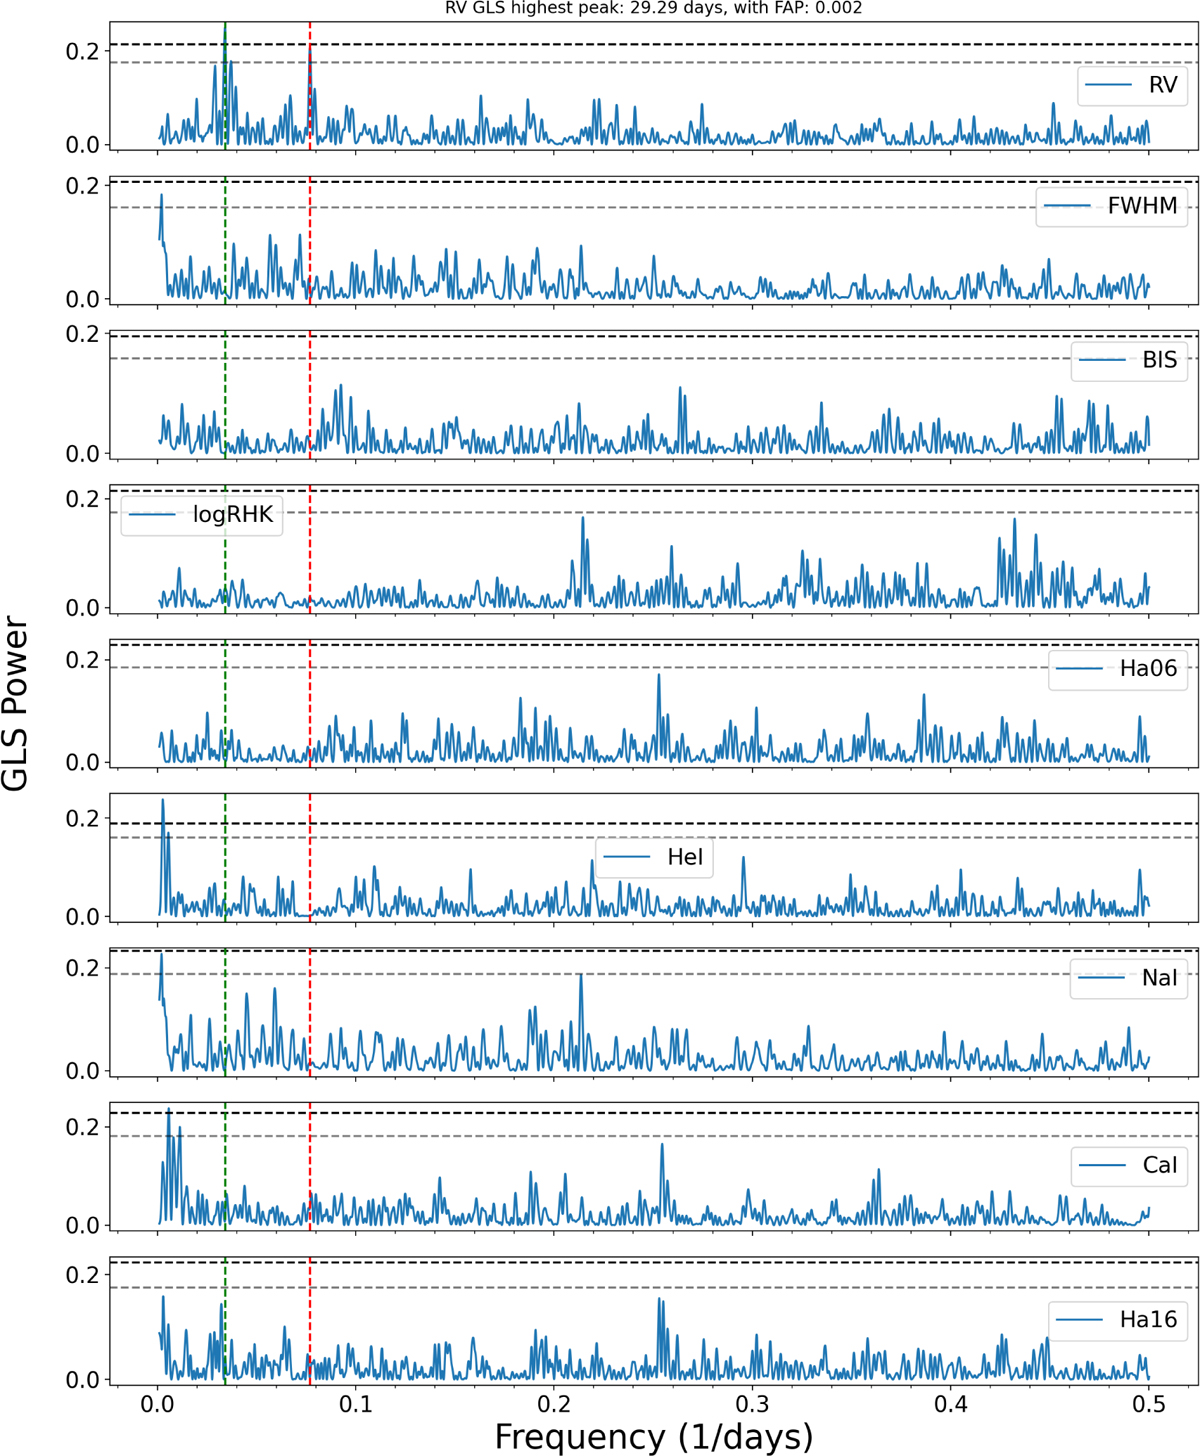
GLS periodogram of HARPS-N RVs and of various activity indexes specified in the labels, after the removal of a linear trend (Sect. 3.2). The main peak of the RV GLS periodogram and that of the TOI-1422 b period are highlighted with a green and a red dashed line, respectively. They do not overlap with any of the peaks from the indexes, which in general do not suggest any clear stellar rotation period. The period corresponding to the highest peak in the RV GLS periodogram, and its False Alarm Probability (FAP), are written on the top of the first panel, while the horizontal dashed lines remark the 10% and 1% confidence levels (evaluated with the bootstrap method), respectively. The three peaks surrounding the RVs main frequency can all be explained as aliases of the 29-day signal due to the two highest frequencies of the window function (190 and 390.3 days, as shown in Fig. D.2 and Fig. D.3).
Current usage metrics show cumulative count of Article Views (full-text article views including HTML views, PDF and ePub downloads, according to the available data) and Abstracts Views on Vision4Press platform.
Data correspond to usage on the plateform after 2015. The current usage metrics is available 48-96 hours after online publication and is updated daily on week days.
Initial download of the metrics may take a while.